3DMark11 – 1280 x 720p Standard Performance Setting
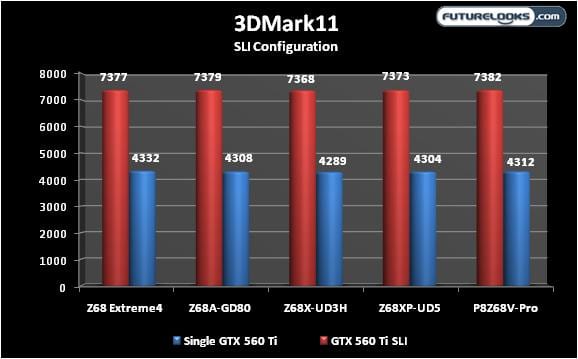
Here, we see the arguable 3D benchmark standard showing us a bit of the system’s overall 3D performance. Most of it is video card performance. But, some motherboards interact more aggressively. The surprising change up is the near even scores with the Extreme 4 pulling off a top spot.
Metro 2033 – 1920 x 1200 Maximum Settings

Whoever says Z68 boards can’t get their game on might want to double check their data, or lack there of. Granted these aren’t the highest frames, but you can try running Metro 2033 at our resolution and settings to see how well your system does especially with two ZOTAC GTX 560 Ti in SLI.
CineBench R11.5 – Likes SSDs Too!
Rendering in this benchmark is very CPU intensive and sensitive to things like core frequencies with Intel Turbo Tech. A primary SSD offers performance alone. But, what you may not know is that rendering programs can and often do benefit from using an SSD in both cached and non-cached configurations. The Core i7-2600K netted a 6.31 average multi core and 1.41 single core score without. But with the SSD, it did much better as you can see below.
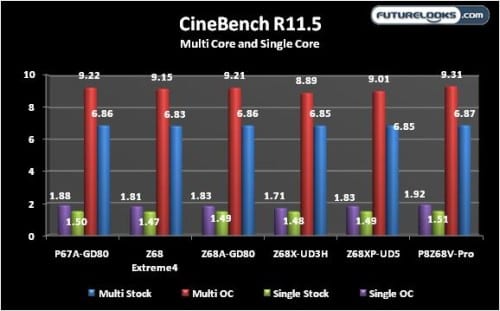
Compared to the test system running on a standard platter hard drive, both multi and single core scores improved with all the platforms. The pack was close during standard operations. But, the pack separates a bit further when running a very healthy overclock. Since the bulk of the users won’t run them overclocked, you still get an idea of the refinements built in to the boards.
RightMarkAudio Analyzer
The objective here is to compare the motherboards’ audio performance a bit more objectively than with the human ear. Breaking down audio performance requires a high quality set of head phones, good quality male-to-male analog cable, and RMAA. We actually test 24-bit 48, 96, and 192Hz frequencies. The results are averaged out in our table below.
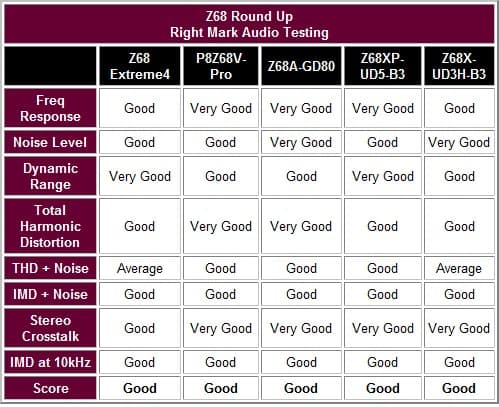
In all honesty, there is hardly any noticeable difference in audio when using a good pair of headphones. The chances are mostly inaudible to the human ear. If I had to which seemed the most up to speed, it would be the Pro and GD80. They were the clearest when pushing the volume. However, the UD5 and UD3H offered the loudest volumes though not quite as crisp. If you opt for an audio card like the ASUS Xonar cards we’ve tested, you’ll get better results and can pretty much omit this entire section.
Cougar Point Input/Output PCIE Bus Limitations Examined
The PCI Express lanes on motherboards with Cougar Point (P6x/H6x/Z6x) chipsets have been getting a little crowded. Even Ibex Peak (P55 chipset) motherboards had some bus limitations. When populating 3 or more PCI Express expansion slots, some devices are then disabled. The table below, provided by ASUS, gives us an idea from among all the platforms.
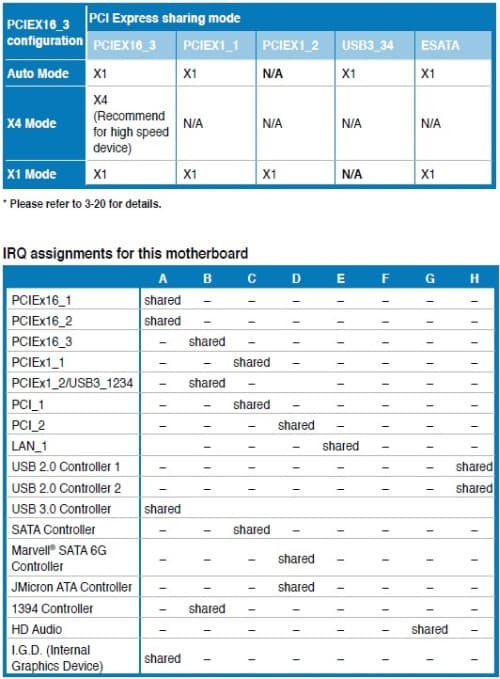
In our NVIDIA SLI tests, if the PCIE x4 expansion slot is occupied, you lose USB 3.0 function since it shares the bus lane. Although you can manually configure the PCIE x4 slot mode, you’ll have to sacrifice USB 3.0 or eSATA performance or function. In SLI or CrossfireX gaming configurations, all the boards still rocked the frame rates. But, after adding any PCIE expansion card, USB 3.0 was the first thing to vanish. The only board exempt from the shared limitations is the ASRock Z68 Extreme 4 because it has a separate PLX controller. However, if you utilize the board’s rear eSATA ports, you lose the Marvell controlled internal SATA port function. There is some kind of limitation for everything it seems.
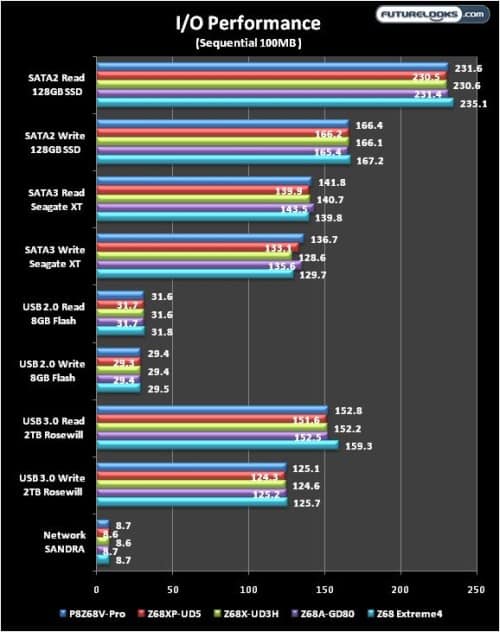
Since we tested our batch of boards as a budget conscious consumer, we tested all the IO using one video card and no extra PCIE cards. In this stock setting, IO performance remained full speed for all the boards with the Extreme 4 moving just a few more MB/s here and there. Again, when running SLI and PCIE card, at least the Extreme 4 remained IO functional while the others didn’t.