
Test Software Selections
For this review, here are the applications we’ve selected for testing.
- PCMark07
- 3DMark11
- Alien Vs. Predator DX11 benchmark
- Resident Evil 5 DX10/DX9 benchmark
- FRAPS
- Metro 2033
- CrystalDiskMark 3.0.1
- OCCT
- ATTO Disk Benchmark
- FurMark Burn-in
- RightMark Audio Analyzer 6.2.3
This is pretty much the same software I have used in all my reviews thus far. I did have to add a new piece to the collection in the form of ATTO Disk Benchmark for testing the true performance of the Patriot Pyro SSD. I will go into further details in the I/O testing section to come.
BIOS and Overclocking Notes
As we have seen before, the standard BIOS you will find on the GIGABYTE GA-990FXA-UD3 is the tried and true BIOS we have all come to know and love. There is nothing new here as the boot sequence, response, layout, and design are the exact same as the GA-990FXA-UD5 and GA-A75M-UD2H. I would like to point out that the GIGABYTE TouchBIOS can be installed from their site for any supported Intel Z68/P67/H67/H61 and AMD A75/A55/900 series motherboards if you’d like a GUI.
Please note that I like to do my testing in a manner that will reflect the majority of users. The TouchBIOS install is an optional update and something only those who wish to use it will experience. Everyone else to start with the standard BIOS. As such this is the BIOS I used. I think the anecdote that would apply best is “don’t fix it, if it ain’t broken”.
I did have some trouble with overclocking the GA-990FXA-UD3. It is built as the entry level board for the 990FX lineup and thus lacks the more robust power system and heatsinks that you find on the UD5 and UD7. The UD3 and UD5 both have 8+2 power phasing, but the 990FXA-UD5 has a beefier heat sink and Driver MOSFETs for better power management. This is to improve power efficiency, but also helps improve overclocking results.
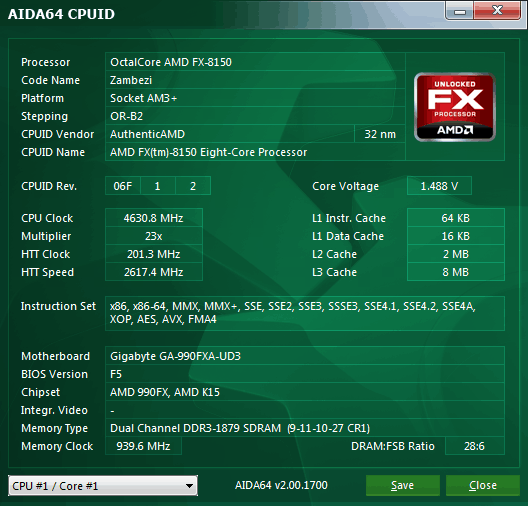
The GA-990FXA-UD3 falls just short of the performance we saw with the 990FXA-UD5 in the Bulldozer release review coming in at 4.63 GHz maximum. Even at the speed of 4.63 GHz, the UD3 was not 100% stable. It passes PCMark07 testing and runs Battlefield 3 on High graphic detail with no issues. Once put under a heavy CPU strain such as Folding@Home, Crunching, or most standard stability tests, it results in peak voltage instability and a system crash.
I attempted again several times, but could only maintain stability by pushing some of the voltage values in the RED. This is not something I expect users to run on a daily basis. If you are using an FX-8100 series CPU like myself, I recommend keeping the CPU voltage below 1.45V and clocked around 4.2 GHz to 4.4 GHz with turbo disabled. This should yield decent performance improvement while keeping the system 100% stable. Going beyond 1.45V is when the GA-990FXA-UD3 seems to struggle with peak voltage regulation.
Total System Performance (PCMark07)
As with past motherboard reviews, I like to start with PCMark07 and a total system performance break down. PCMark07 provides a very comprehensive set of real world simulations to gauge performance. Results show a variety of categories and can often comparatively show weaknesses in a system. Keep in mind these results will favor the GA-990FXA-UD3 as its primary system drive is the Patriot Pyro 60 GB SSD.
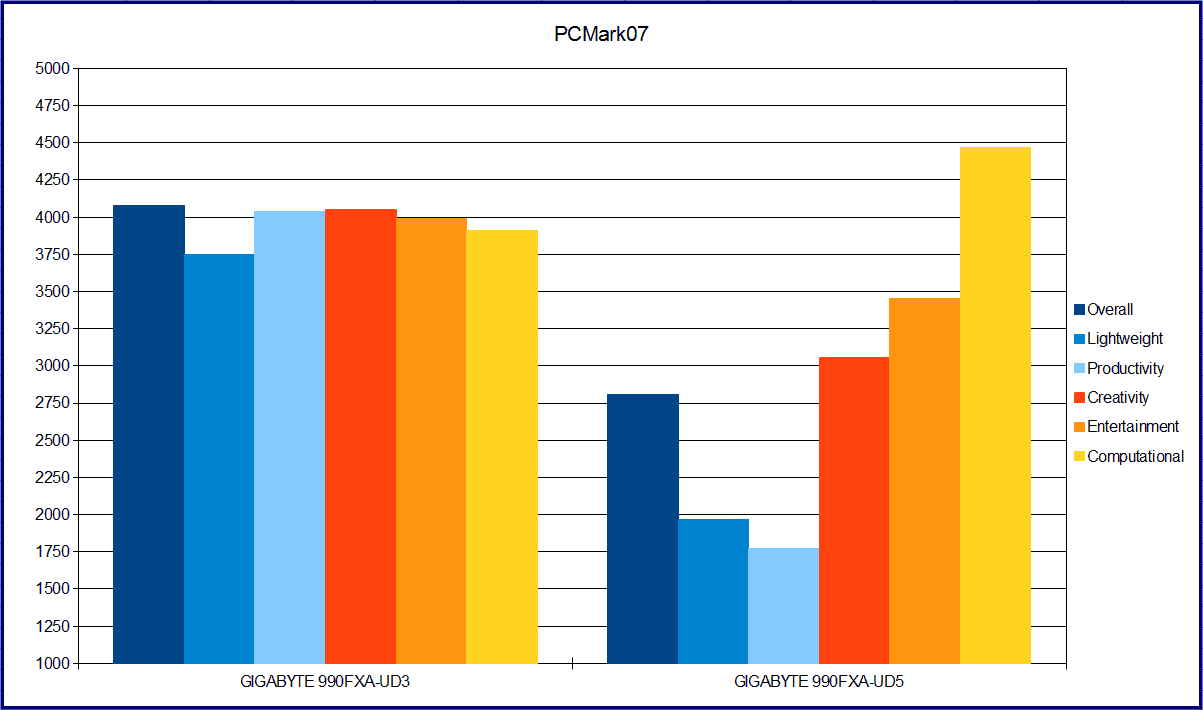
As I stated there is an obvious advantage with the 990FXA-UD3 because of the SSD being used for testing. I will be using this SSD for all forthcoming tests, so the GA-990FXA-UD3 will be my baseline for upcoming reviews. You should note the computational score of the UD5 is 558 points higher. I cannot say for certain, but I believe this is because the UD5’s better power management allows it to keep the AMD FX-8150 at max turbo for longer periods of time. It is also important to note the computational test is the one test where the SSD has the least impact on performance.
Synthetic Graphical Performance (3DMark11)
In this benchmark we will test how well we should expect the GIGABYTE GA-990FXA-UD3 to perform when it comes to gaming in general. This test also allows me to look at performance when gaming at a low and medium graphical level to give everyone a better idea of what their system should be capable of when using a different GPU than the HD 6850.
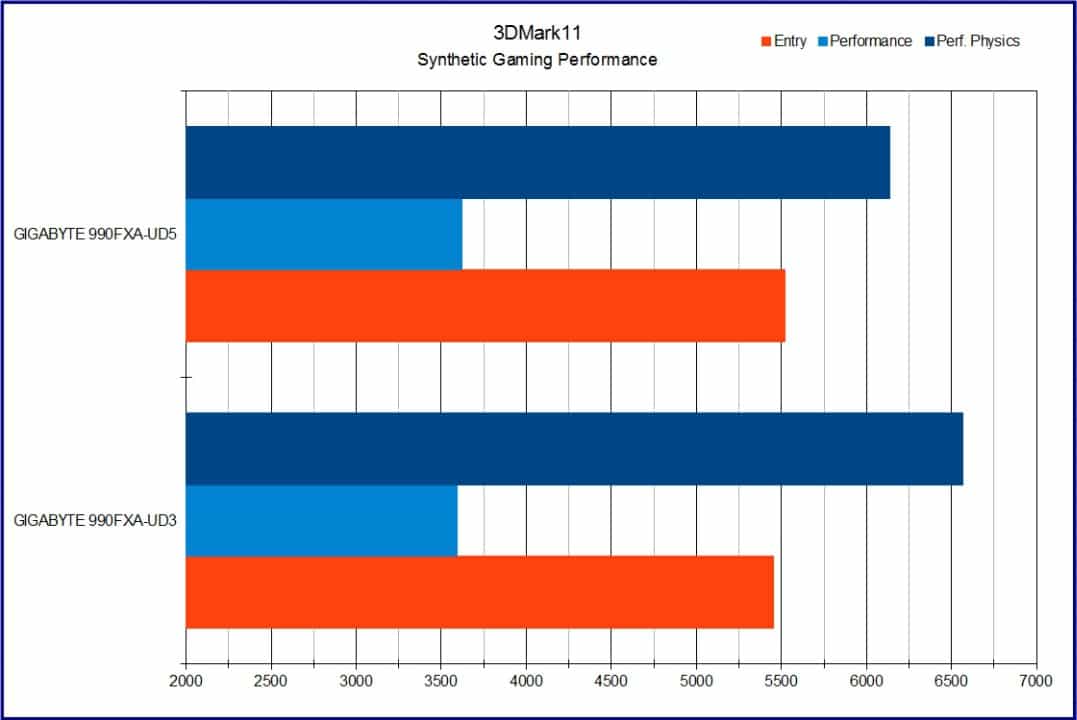
As you can see there is nearly no difference in actual performance. There is a slight advantage for the 990FXA-UD5, but nothing of importance. There is a difference in the Physics score for the 990FXA-UD3 because I used the recently released Windows 7 Bulldozer Optimization patches, which strengthens the CPU performance.
Let’s continue on with some real world gaming tests.