Benchmarks and Software
The software for the tests include 3DMark11, PCMark07, Alien Vs. Predator DX11 benchmark, Resident Evil 5 benchmark, CrystalDiskMark 3.0.1, OCCT, FurMark Burn-in, and RightMark Audio Analyzer 6.2.3.
3DMark11, Resident Evil 5, and Alien Vs. Predator are being used to determine if gaming performance is different between these two boards using the same video card. CrystalDiskMark 3.0.1 is my testing software for SATA 2.0 and USB 2.0/3.0 throughput. This test will focus more on how well the A75 Hudson FCH compares to the AMD SB850. RMAA 6.2.3 is the test bed for audio performance as the board has claimed enhancements to audio fidelity.
Finally the OCCT and FurMark Burn-in software is for stability testing when overclocking. While I ran other tests to ensure stability, a combination of these two seemed to weed out instability the fastest.
BIOS and Overclocking Notes
The BIOS is not the full graphical UEFI like you can find on other AMD A75 based motherboards. GIGABYTE uses a more traditional looking Hybrid UEFI which looks like a traditional BIOS but has many of the UEFI features within. While I was a little disappointed, GIGABYTE quickly made up for it with some nice features you can find in their BIOS. The CMOS settings you use can be stored into profiles with custom names. The GIGABYTE A75M-UD2H also has build in dividers for all the buses controlled by the primary system clock. At certain intervals, these dividers will kick in and bring those bus figures back into a working range.
While these dividers can limit performance at times, it helps to minimize things hindering your overclock to just the CPU and RAM. This results in any bus value between the 100 MHz default to 150 MHz usable. While the sweet spot for overall performance for me was around 132 MHz, I could get Windows to boot at 145 MHz (CPU @ x26 multi for 3.77 GHz). The only downside to the BIOS is the IGP controls are found in 2 locations for no reason. Let’s see if overclocking has any effect in some of our benchmarks.
PCMark07 – Total System Performance
Instead of testing a specific aspect of your system, PCMark provides a total system evaluation by testing a computers capability to handle certain tasks. These include test editing, web browsing, loading programs, loading games, 3D rendering, and more. This time I am going to use the AMD A6-3650 using the on-die 6530D GPU. This should be a good example of the bare minimum you would get from a quad-core AMD APU.
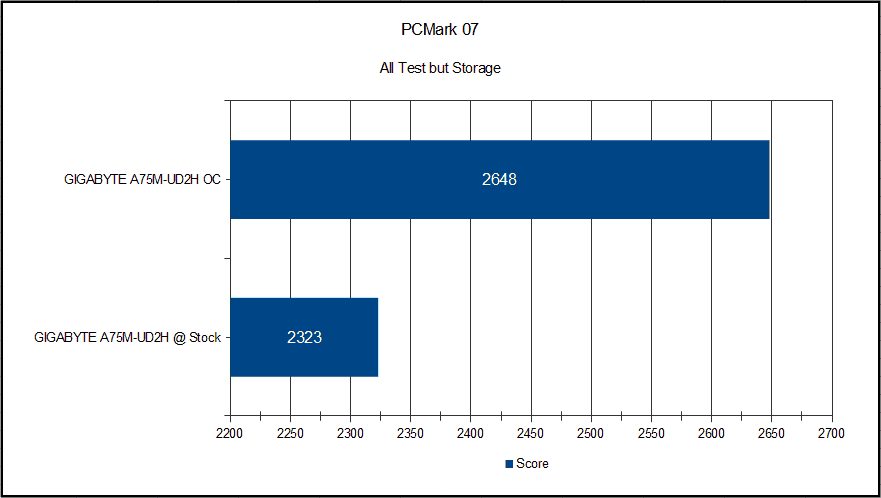
It is hard to provide context to this score as I found many websites currently still use PCMark05. I compared the overclocked results to another system with similar results on Futuremarks site with an i3-2120 with Hyperthreading and a dedicated 550 Ti GPU. I also encourage you to download the free version of PCMark07 and test your own system for comparison. You will find it will take a laptop costing well over $700 or a desktop built specifically for gaming to outperform the GIGABYTE A75M-UD2H with any quad-core APU. This is also only with AMD’s entry level A6-3650.
3DMark11 – Synthetic Graphics Performance
Lets start the testing with Synthetic gaming performance and compare the two systems as a whole. 3DMark11 should gives us a good idea how the A75 board would measure up to a similarly clocked Phenom II processor such as Phenom II X4 925 and Phenom II X4 945. As we know the L3 cache does help in gaming, but how will it measure up the memory bandwidth advantage of the A75 system with the GIGABYTE A75M-UD2H?
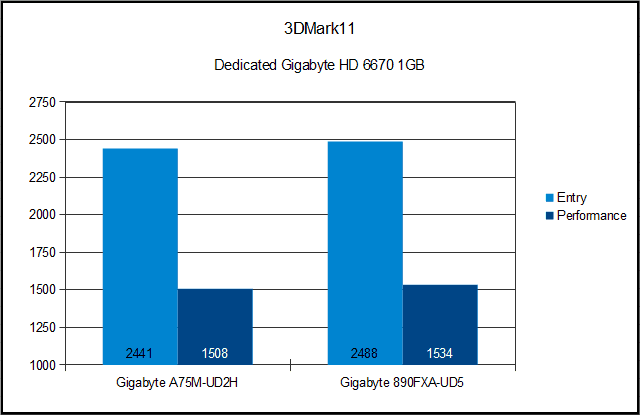
The advantage here goes to the 890FXA-UD5 and the Phenom II. This difference can be attributed to the 6MB of L3 cache of the processor as games typically favour a large cache. The difference is honestly very small, so lets see how that translates to the real world with game specific benchmarks.
Resident Evil 5 and Alien vs Predator – Real World Graphics Performance
Both tests were done at 1920 x 1080 resolution and the benchmark default settings. For Resident Evil 5 this would be quality, texture, and shadowing on High, no AA, no Vsync, and no motion blur in DirectX 10. AvP’s default is texture on high, shadowing on high, AF x16, AA off, and all DX11 features enabled.
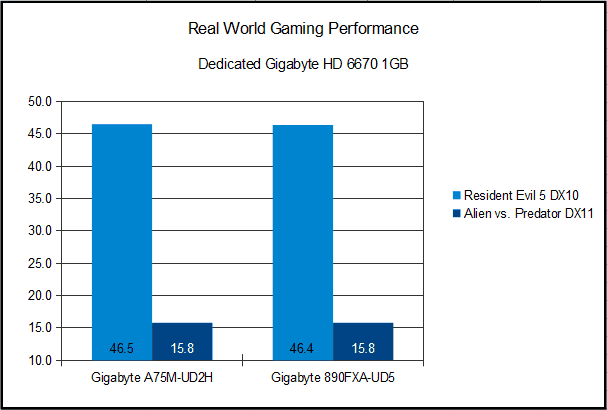
This shows the motherboard does not create any limitations in graphical performance. I am sure these results would diverge with high-end GPUs such as a AMD HD 6970 or Nvidia GTX 570, but it would be related to the CPUs not the motherboards. The on-die Northbridge could potentially be choked by a dual GPU card such as the AMD HD 6990 or Nvidia GTX 590, but I do not see anyone using these cards in an APU build of this price point.
Crystal Disk Mark 3.0.1 – SATA3 (6 Gb/s) Performance
The Phenom II system uses a standard Northbridge/Southbridge configuration with the Southbridge handling SATA and USB. Here we are looking to see if moving the IO a step closer to the CPU will improve throughput or not. This will also compare 890FX Hyper Transport link to the A75M Unified Media Interface in which the latter has much lower bandwidth.
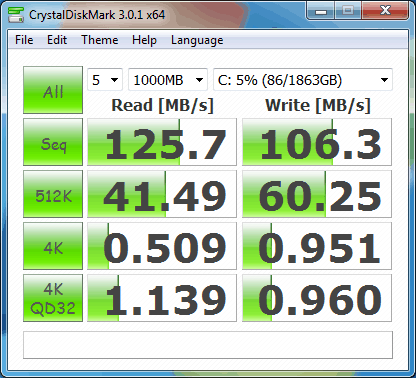
GIGABYTE A75M-UD2H SATA 3Gb/s

GIGABYTE 890FXA-UD5 SATA 3Gb/s
The A75M-UD2H is a little better in all these test with the exception of the 4K QD32 and Sequential write test. It is good to see the UMI link clock rate of 2 GHz does not limit data throughput. This being the case, the UMI should only be a bottleneck in extreme data throughput scenarios such as 4 or more SSDs at 400MB/s+ speeds in a RAID.
Crystal Disk Mark 3.0.1 – USB 2.0 Performance
Since we are already testing data throughput, I thought we would move on to the USB 2.0 testing. This is the same comparison as the SATA 3Gb/s testing, but with the front USB ports instead.
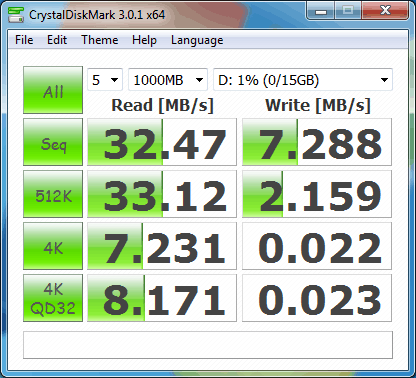
GIGABYTE A75M-UD2H USB 2.0
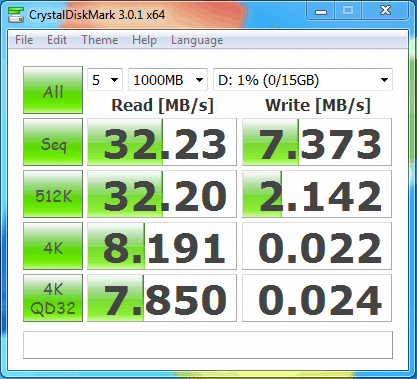
GIGABYTE 890FXA-UD5 USB 2.0
All tests with USB2.0 have the A75M-UD2H within 1 MB/s of the 890FXA-UD5. A difference in performance this small is negligible as several factors can change this in real world applications. The comparatively lower bandwidth of the UMI link between the APU and the Hudson FCH is simply not a factor. Even if you connected a device to all 10 USB 2.0 ports and all 4 USB 3.0 ports, they would not create enough data throughput to cause an issue.
USB 3.0 Performance
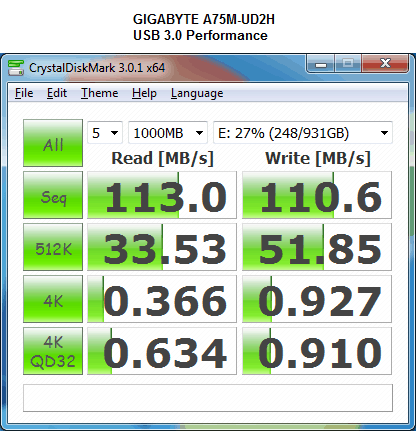
As you can see from the results, the USB 3.0 port is working perfectly. These numbers are well within the average performance of the 7200 RPM drive being used and not too far away from tests done on previous 890GX and 890FX boards with a SATA3 drive in the same enclosure. So it appears SATA3 does have a bit of an advantage of SATA2 with USB 3.0. It is nice to see you can use this with an external drive enclosure and maintain the performance of any HDD installed in it. With new USB 3.0 chipset options other than the Renesas/NEC coming to light, we’ll be keeping an eye on this test for future reviews.