Overall System Performance (PCMark07)
I will start with PCMark07 and a total system performance break down. PCMark07 provides a very comprehensive set of real world simulations to gauge performance. Results show a variety of categories and can often comparatively show weaknesses in a system.
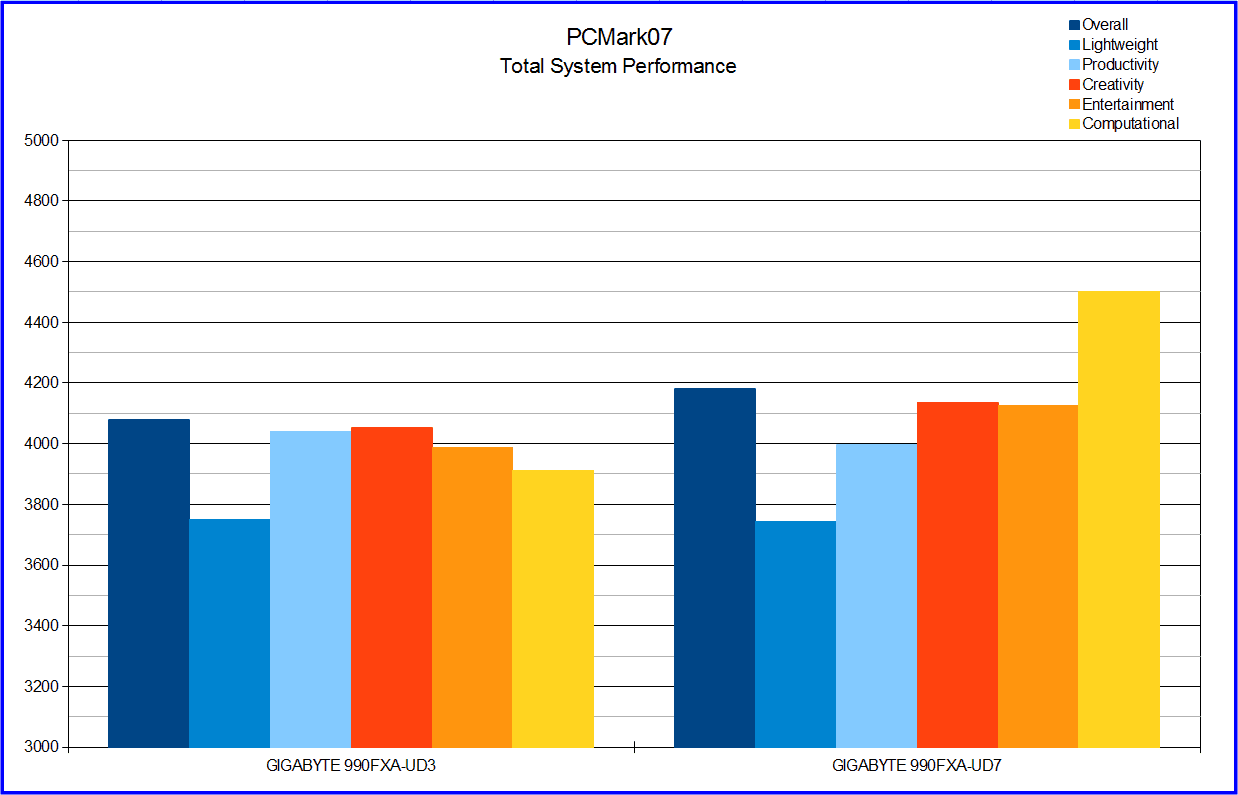
There just isn’t any real competition. The GA-990FXA-UD7 takes the lead in Overall performance, Creativity, and Entertainment tests. There is a significant advantage in Computational due to the improvement in power management which the GA-990FXA-UD3 had issues with. The Lightweight and Productivity tests are virtually identical with the UD3 taking a very small lead.
Synthetic Graphical Performance (3DMark11)
In this benchmark we will test how well we should expect the GIGABYTE GA-990FXA-UD7 to perform when it comes to gaming in general. This test also allows me to look at performance when gaming at low to medium graphical levels. I will address high and extreme levels in real world testing. Also note the Physics score is taken from the Performance Test.
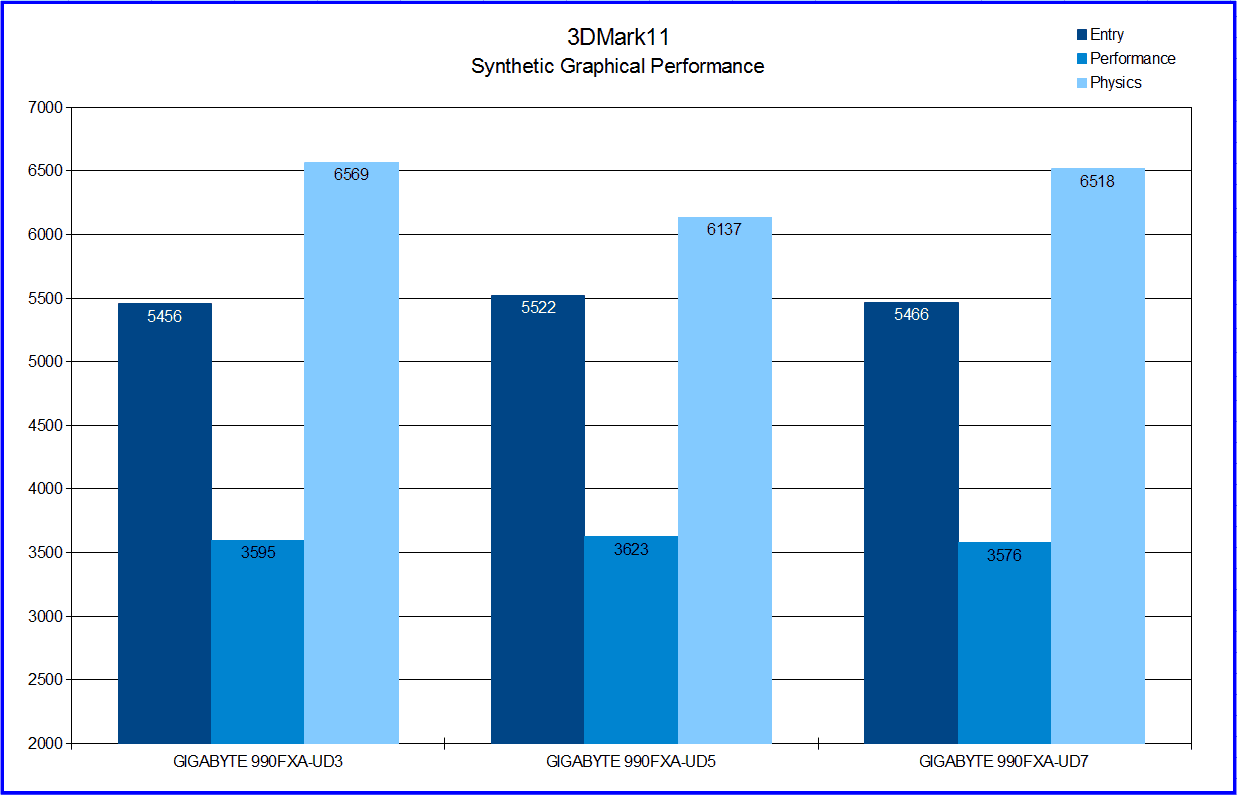
In this test all three of GIGABYTE’s 990FX boards come within less than a 100 points of each other in each test, except for Physics. For some reason the UD5 falls a little behind in this category, but this is because those numbers were done prior to the Windows 7 Bulldozer patches. While these patches reduce performance by a very small percentage, it did improve multi-core performance which affect tests such as Physics.
Real World Graphical Performance (Alien Vs. Predator, Resident Evil 5, Metro 2033)
The selection of games I use are not a comprehensive test as it is only 3 games. I use these games to test the widest range of game variables with the least number of tests. This set covers DX9, DX10, and DX11. It shows performance on a game with a lot of graphical features in Metro 2033 and a game with relatively few graphic features in RE5. In the near future I will be replacing Metro 2033 with Battlefield 3.
Testing for Alien Vs. Predator is done with the default high DX11 settings. Resident Evil 5 is tested with all options set to as high as possible with frame rate unlocked, motion blur off, and VSync disabled. Metro 2033 is tested at its maximum settings. Battlefield 3 is tested with the games chosen settings based on my GPU which is High. This has the Antistropic Filtering at x16, Post Anti-aliasing on High, AA Differed set to Off, and all other options on High.
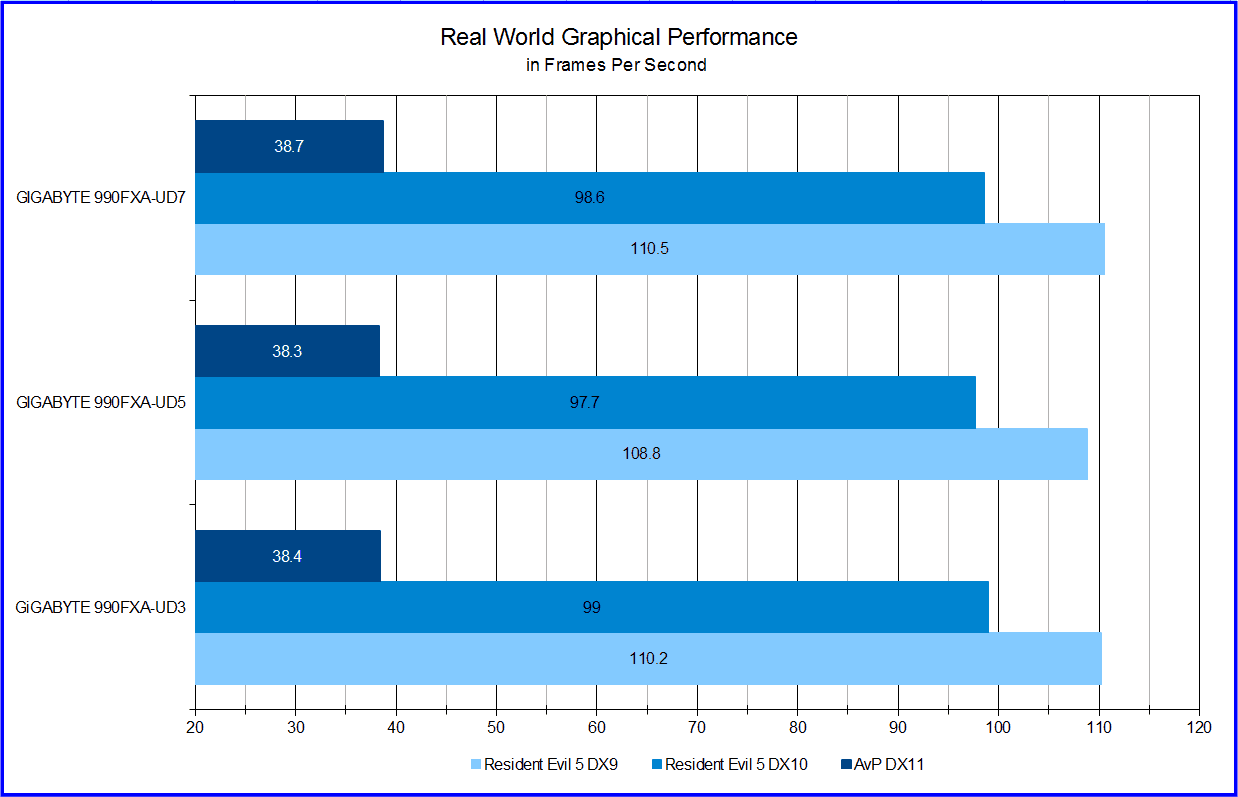
In real world performance the UD7 did come out on top, but not by enough to consider it a definitive win. These results are virtually identical with it being very clear the bottleneck is the GPU’s performance and not the motherboard. Now lets take a look at a DX11 title that will push the system to the limit of its capabilities.

This time we see performance of the GA-990FXA-UD7 matches the UD5 in minimum, matches the UD3 at average, but takes the lead by 2 FPS at maximum. This would seem like the UD7 is giving a little more breathing room and may provide wider improvement margins with more powerful GPUs.
SATA 6 Gbps I/O Performance (CrystalDiskMark 3.0.1 and ATTO Disk Benchmark)
I use CrystalDiskMark for all testing except with the testing of sequential Read/Write testing for the SSD. CrystalDiskMark provides an average performance level of the 1 GB data set in four common scenarios. I use ATTO as it provides a better idea of maximum performance of the I/O by using a smaller 256 MB data set being transferred in varied packet sizes.
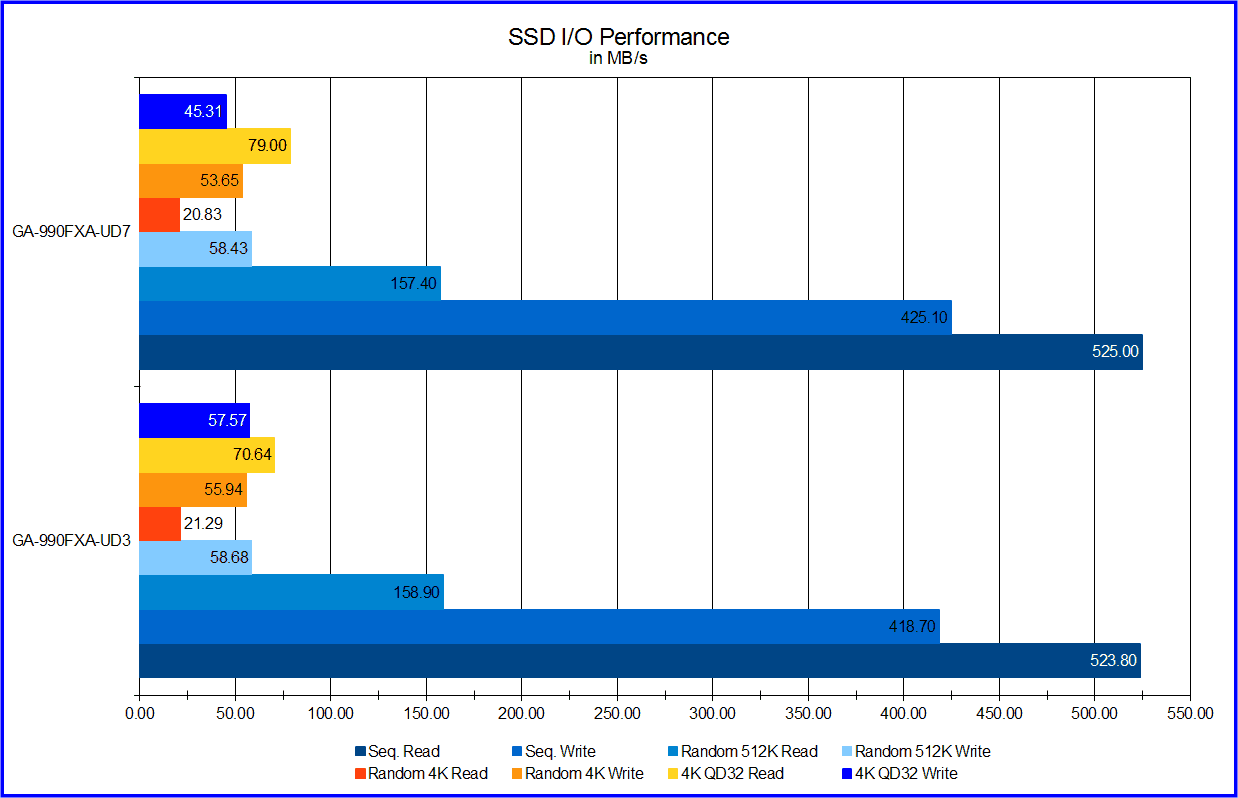
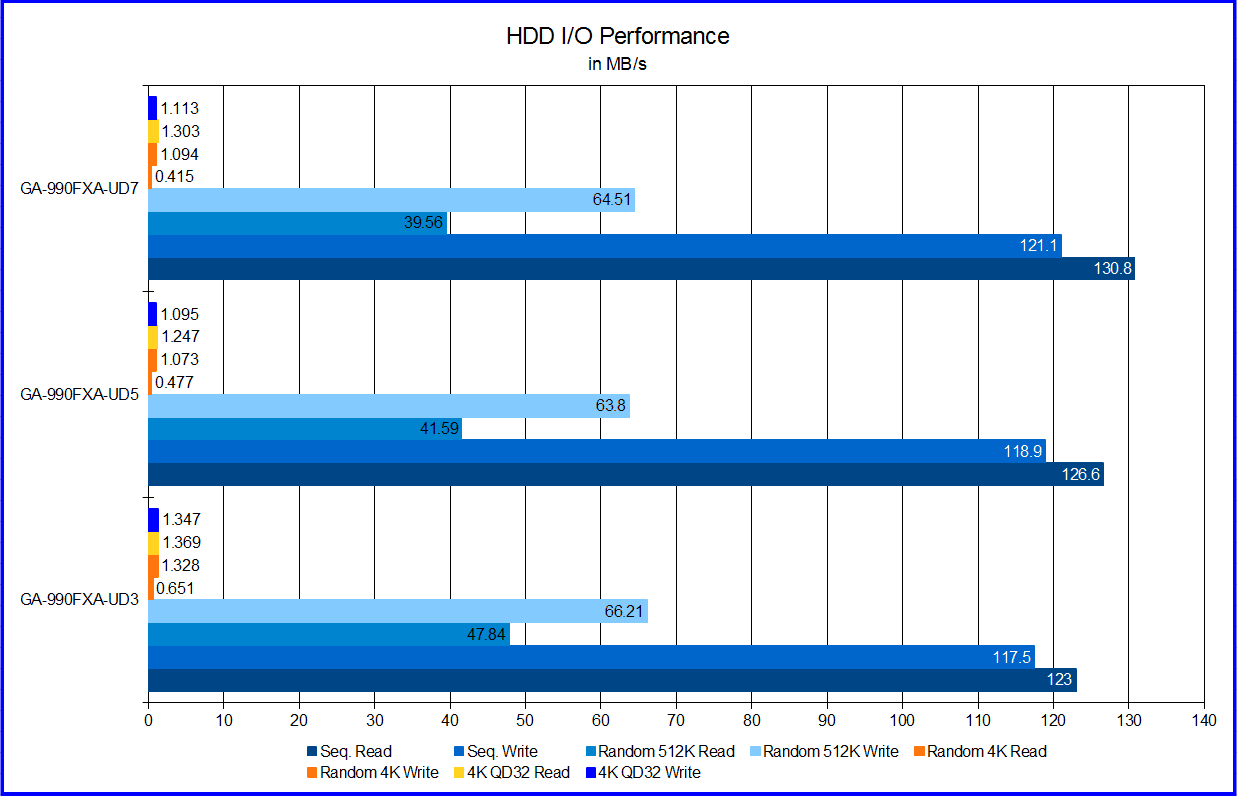
The performance when it comes to the SSD is pretty back and forth between the 990FXA-UD7 and 990FXA-UD3. Each taking that fair share of victories. The results for standard mechanical drives is a little different as the UD3 takes a consistent lead in everything but sequential read/write performance. Keep in mind all three of the GIGABYTE 990FX boards use the same ITE IT8720 chip and I was using the AMD I/O drivers so the exclusion of the UD5 is not relevant.