Benchmark Suite Notes
As per standard operating procedures, the overclocked system has to pass three iterations of Sysmark 2007 or we don’t count it as stable. That said, the suite consists of programs that test the entire platform’s features and sub-systems under real world applications. The benchmarks include: Sysmark 2007, CineBench R11.5, 3DMark11, Metro 2033, RightMarkAudio Analyzer, input/output performance, power consumption and quality control.
Power Consumption was measured using a power meter from the outlet. Quality Control was done utilizing both our senses looking for crooked or substandard components and a laser thermometer. We’re looking for EMF, noises and any unusual hot spots compared to previous P67 platforms and the current batch of Z68 boards that we’ve already looked at.
Sysmark 2007
This program benchmarks a computer’s overall performance rating the system in areas such as E-Learning, Video Creation, Office Productivity, and 3D Modeling. E-Learning uses apps like Adobe Flash and Photoshop to execute rich image, video, and audio in web based presentations. Video Creation creates a video rendering uses apps like SONY VEGAS to stress the system in professional video editing using effects and images from multiple sources, content types and formats. Office Productivity uses the real Microsoft Office to assess performance gains using these types of application. Finally, 3D Modeling professional applications to stress the system in real world modelling simulations.
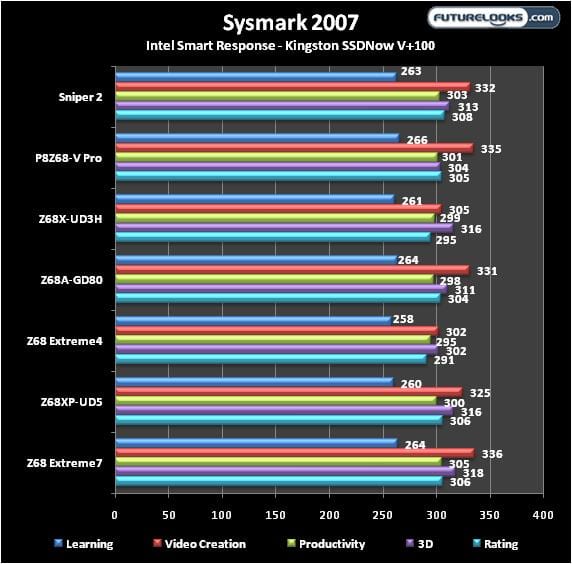
Obviously, having the full speed PLX assisted PCIE bus and lets the system perform at its potential and beyond. Plus, the more aggressive Turbo Tech boost this round seems to be clocking up faster even with a big load placed on the system. This means the ASRock Z68 Extreme 7 will spring into action much faster than previous boards on the market.
3DMark11
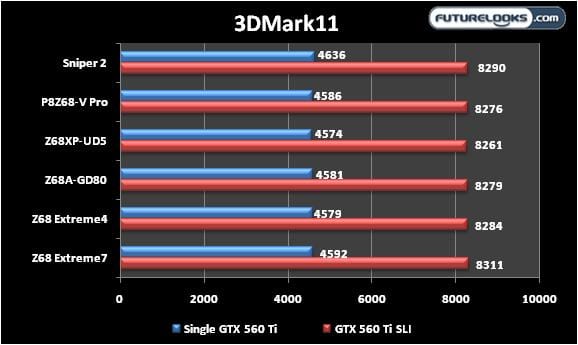
3DMark11 needs no explanation really. It just shows us how the more feature aggressive Z68 platforms benefit the benchmark and potentially translate into gaming performance under DirectX 11. If the benchmark really tested audio and network, the GIGABYTE G1.Killer Sniper 2 (full review coming soon) which would lead the pack by far. However, the Extreme 7 likes graphical benchmarks even if synthetic.
Metro 2033
Metro 2033 continues to wreak havoc on all video cards especially when maxing out every last detail. Single and SLI tests were performed as per Standard Operating Procedure (SOP) to see if there are any problems with these features. I also tested CrossfireX using some slower AMD cards just to make sure the function works.
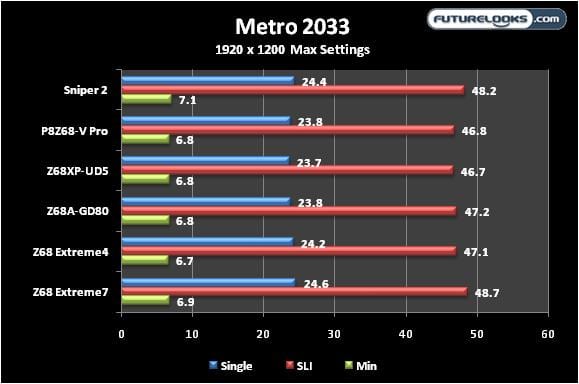
There were no graphic anomalies here. The Extreme 7 was ever so slightly more aggressive than the impressive Sniper 2 but only just. If nothing else, it just shows a more efficient PCIE thanks to better implementation using the extra PLX chip.
Cinebench R11.5
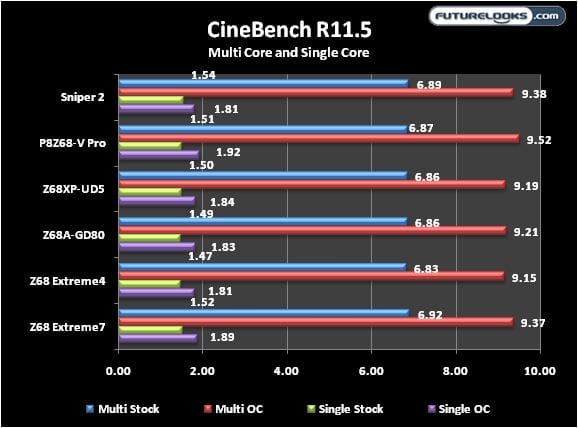
The Extreme 7 and Sniper 2 fight for second place at stock configuration with the Extreme 7 showing a much more aggressive side than its Extreme 4 sibling. It’s still a bit faster than the Sniper 2. It does quite well when overclocked but not quite enough to beat ASUS and its V-Pro’s digital PWM.
IO Performance
Z68 Chipset controllers pretty much all perform the same under individual storage tests except when the PCIE expansion slots are loaded down. For a more ideal comparison, I used some of the fastest platforms and included an X58 for good measure. Keep in mind that the X58 does not offer native SATA3 (6Gbs) support but Marvell controllers which tend to be slower. I’m also using a Kingston HyperX 120GB SATA3 SSD instead of the 2TB Seagate Barracuda XT in order to push the controller further.
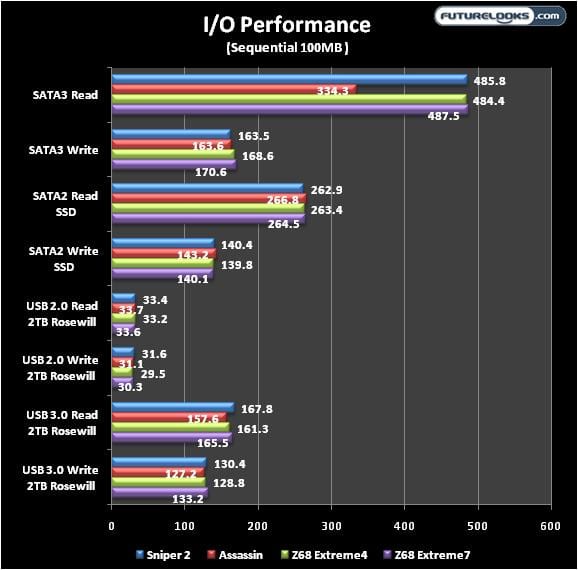
As you can see, the X58’s Marvell controller isn’t as agile as the Intel Z68 chipset. However, SATA2 controllers are Intel native and don’t slow down. And, the USB controllers are the same for the most part right down to drivers. Any Z68 without full speed X58 or PLX controllers are roughly 20MB/s slower on the average.