3D Gaming Benchmarks
Three different game titles were picked based on game engines. Crysis Warhead and Battlefield Bad Company 2 both can give a system a good work out. BioHazard 5, while older, still gives users playing older games an idea of performance. Just make sure you’re running the latest drivers and a competent video card.
Crysis Warhead
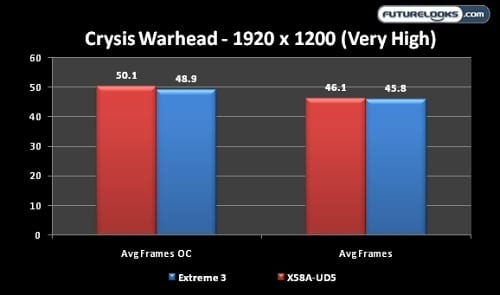
Still one very graphics intensive game, the platforms offer just enough frames to keep it smooth like most folks like. Only a couple frames separated the two platform due to the X58A-UD5’s more aggressive nature during overclocking.
Battlefield Bad Company 2
Due to a few game and driver glitches associated with advanced high settings, three quick BFBC2 demos were recorded using only high settings with the help of Fraps. The demos involve darkness, lighting, fog, and large detail mapping.
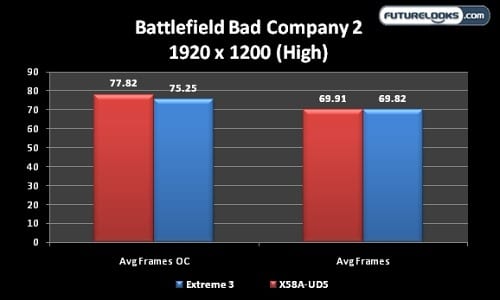
The nice thing about both platforms is that they run the demos very smoothly. The X58A-UD5 provided a few more frames on the average when overclocked than the Extreme 3. However, we’re not exactly talking huge margins here and we’d never be able to feel the difference in real world gameplay.
BioHazard 5 Demo
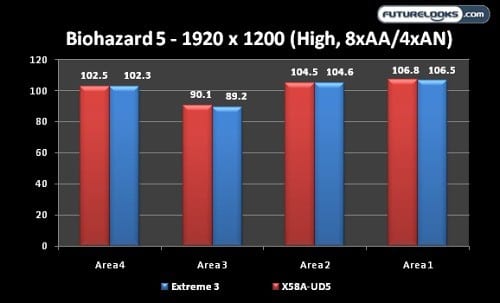
This demo gives us a peak at the motherboards in action. The X58A-UD5 just pulls a head by a point or less. One thing is certain. Both platforms love running the benchmark demo with the GTX 480 in the driver’s seat.
SATA3 and USB 3.0 Benchmarks
We’ve noticed variations in SATA3 and USB 3.0 performance over the last few review so we’ve decided for the sake of brevity to concentrate on these areas instead. We rarely see major variances in SATA2 and USB 2.0 performance these days and even when we do, it’s not worth talking about. USB 3.0 and SATA 3 have a lot of growing up so these benchmarks should see who’s maturing quicker in terms of implementation.
CrystalDiskMark 2.2 – USB 3.0
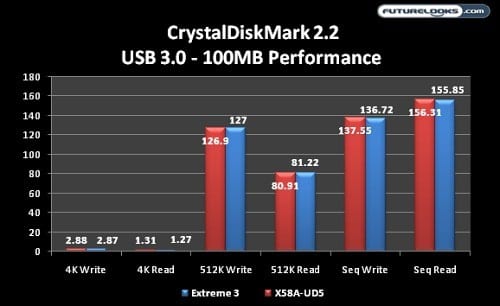
Because both platforms rely heavily on the same NEC USB 3.0 controller chip without any help from PLX system bus chips, we didn’t expect much variance. Neither really out paced the other. Any of the minor variances are probably due to the physical design and components of the motherboard’s system bus.
CrystalDiskMark 2.2 – SATA 3
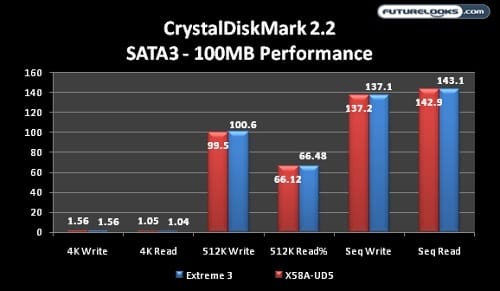
Again, both platforms share the same Marvell SATA 3 controller and drivers. As expected, performance is pretty similar. The variances could be attributed to trace designs. The interesting thing about both platforms is that the write speeds are higher than read.
Power Consumption
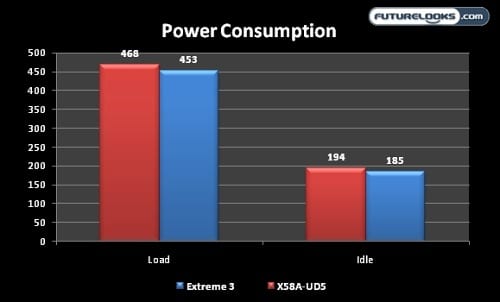
Before you go off screaming “what the heck”, keep in mind these platforms were tested with the Core i7-980X and are carrying a big phat ZOTAC GTX 480 video card which does a fine job of crunching impressive amounts of data. However, it comes at a cost in terms of power consumption. Pro users with this kind of equipment know what to expect when pulling watts from the wall. The Extreme 3 was clearly less power hungry overall however, this is without the GIGABYTE’s Green Power turned on which would have evened it up.