Test System Setup
For the purposes of our testing, we put together a system that hopefully reflects that needs and budget of a mainstream gamer…
- CPU(s): AMD Phenom II X4 965 Black Edition CPU
- Motherboard: GIGABYTE GA-890FXA-UD7 (F2 BIOS)
- Memory: Kingston HyperX DDR3 1333 MHz 8GB Quad Channel Memory Kit
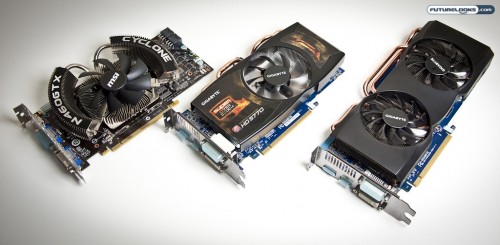
- Video Card 1: GIGABYTE GV-R5770SO-1GD Super Overclock (HD 5770)
- Video Card 2: GIGABYTE GV-R583UD-1GD (HD 5830)
- Video Card 3: MSI N460GTX Cyclone 768D5 OC Edition
- Hard Drive: INTEL X25 80GB SATA2 SSD
- CPU Cooler: Thermaltake V1 CPU Cooler
- Power Supply: Ultra Products X4 750 Watt Modular ATX Power Supply
- Optical Drive: LG SATA DVD Writer
- Operating System: Windows 7 Ultimate 64 Bit
- Other: 2 x Silverstone AP121 Air Penetrator 120mm Case Fans
With the exception of a grossly excessive amount of DDR3 memory and the INTEL SSD, we think that the system does a pretty good job of representing that. We already know that excessive amounts of memory do nothing for gaming and we only used the SSD to speed up the time to load up our benchmarks. Neither should have an effect on the big picture we’re trying get from the results. All of our components were installed in an open test bench (High Speed PC Top Deck Tech Station).
Testing Notes

All of our tests were conducted using the latest available drivers and BIOS revisions. As of the date of this article, we are running ATI Catalyst 10.6 drivers for the HD 5770 and HD 5830. The the GTX 460 gets run with the latest public release of the GeForce driver release 258.96 which was released on launch day to support the card. Since we are using a non reference GTX 460 board from MSI, this board has been underclocked to mimic the performance of cards that you would find at the $199 US price point.
For GPU temperature testing we will be using FurMark 18.2 to push each GPUs to their limit and reveal max temperatures and noise levels. Idle temperature will be taken 30 minutes after booting into the system from the off position with each video card while load temperature will be taken after each card endures 30 minutes of torture. Ambient temperature within the room is maintained at 25C for all temperature readings. GTX 460 readings will be for the MSI card only as it does not use a reference cooling solution.
Noise levels will be measured at both load and idle using a noise level meter pointed directly at the middle of the video card and placed 6 inches away. We are looking for the relative noise level between each video card in terms of higher or lower noise between the three video cards. Again, we are not using a stock reference cooler so the results are only representative of the MSI card.
Power draw will also be measured as a whole system consumption at both idle and load conditions using a power meter plugged into the PSU then into the wall outlet. Idle load will be measured at 30 minutes after booting in from the off position. Load measurements will be taken before the conclusion of our FurMark stress test when the GPU is producing the highest level of heat.
Unless otherwise stated, benchmarks will be performed using default settings and we use a standard resolution of 1920×1080. Please see each test for specific modifications. Let’s get cracking!
Synthetic Benchmarks
There’s a place for synthetic benchmarks in all testing. They give us a rough idea of how things will play out as we progress through out testing with other real world benchmarks. If something is out of whack, we can quickly check back to our synthetic benchmarks to see if we need to test again. We start off our testing with a few of the greatest hits…
3DMark06

We start off with Futuremark’s 3DMark06 as our warm up benchmark. While an older benchmark, it sets the tone for how DirectX9 tests should pan out. Yes, there are still people that play DirectX9 games out there and we’ll make sure they are taken care of. As it would seem, the new hotness of the GTX 460 does seem very eager early in this round of testing. I’m hoping to see this translate into playable frame rates when we get to the game benchmarks.
3DMarkVantage

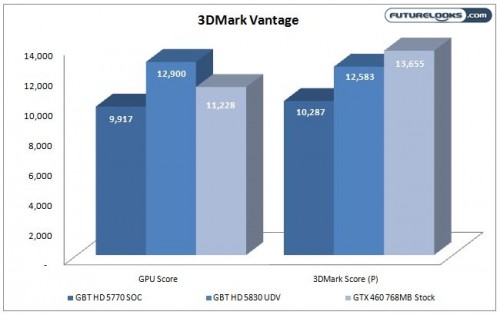
Futuremark’s 3DMarkVantage is the standard when it comes to synthetic benchmarks. Representing DirectX 10, the benchmark gives us a rough idea of how things will play out in more modern games. We find it interesting that while the GPU Score favours the HD 5830, the GTX 460 mops up in the overall performance score. It is inconclusive whether the GTX 460 will continue due to the lower GPU score which is the test of video card capability.
Cinebench 11.5

Cinebench is a favourite for CPU and memory tests, but it does house an OpenGL test component. While few games these days use OpenGL, some folks out there may be using OpenGL apps and knowing how the cards perform may be important information. It would seem that ATI’s strong workstation background with OpenGL has carried into the Radeon HD lineage as both the HD 5830 and HD 5770 clearly command this benchmark.
