3D Power and Touch BIOS
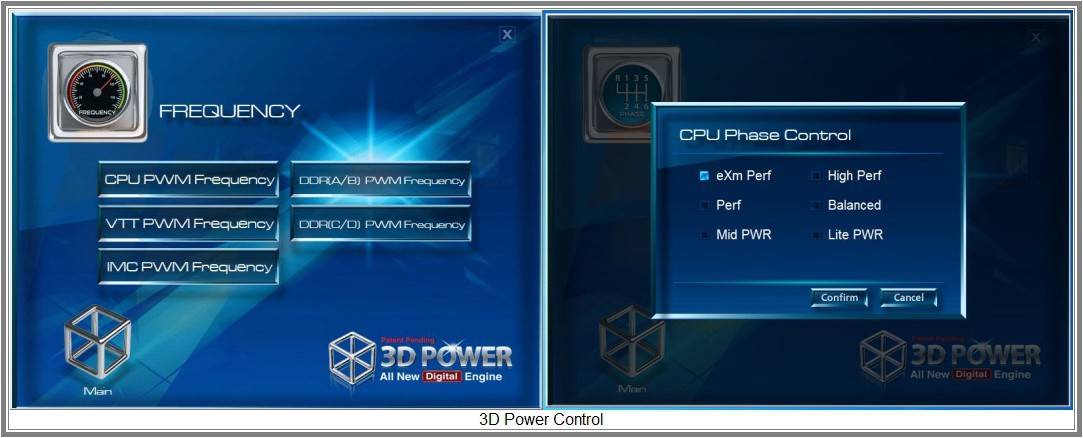
3D Power and Touch are easy to figure out. 3D Power allows one to tune your system to perform at peak levels at all times. On the flip side, it can also be used for better power management to ensure the lowest possible power consumption. I tested the lowest and highest settings to see if there were any performance differences. You can basically save some power if you select the one of the more aggressive power saving settings. Otherwise, power consumption was slightly up in “eXm Perf” mode.
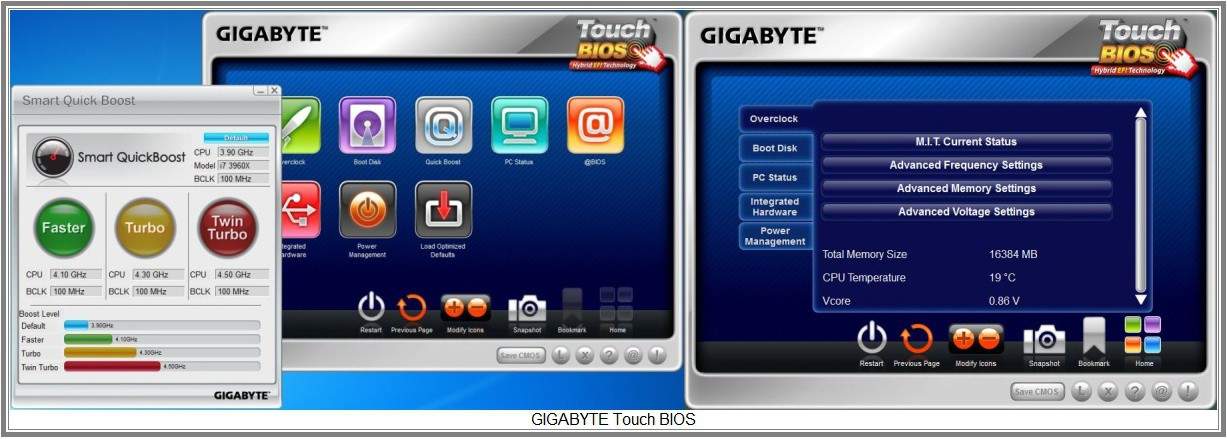
The Touch BIOS comes in handy if you need to do any peripheral or expansion tweaks on the fly without having to reboot. It’s also as easy as Easy Tune 6 when it comes to overclocking except you have access to the voltage settings to ensure stability.
Like any Windows based utility, it may or may not be stable depending on your settings. If you aren’t sure about your overclocking skills, there’s also the Smart Quick Boost app that offers three automated levels — Faster (4.1GHz), Turbo (4.3GHz) and Twin Turbo (4.5GHz) which work without fail. Just keep your CPU temperatures in check if you’re using the liquid cooling system CPU cooler that comes bundled with some of the Intel CPUs. Temps weren’t too much for the NZXT Havik 140, Thermaltake Frio OCK, Noctua NH-C14 or NH-D14 coolers however.
Overclocking the UD3 and UD7 Motherboards
<--adsense#garay-->BIOS overclocking was extra tough mainly due to our particular 3960X not co-operating. However, ET6 easily ran 4.5GHz on both motherboards without any fuss at all. Make a couple selections and apply. The systems ran some full loads and OCCT without crashing or locking up. Using the BIOS produced almost 4.6GHz at 1.4 volts. The lab Core i7-3960X hasn’t been able to get much higher as of late making me wonder if we could get Intel to warranty our engineering samples under their new overclocking protection program. We found that temperatures climbed quickly, making it hard for the Asetek liquid cooler to manage temps at 1.4 volts.
It’s not all roses with the GIGABYTE boards. The 3D BIOS continues to be problematic especially on the UD7. The BIOS suffers from an odd lag of sorts when making selections which are particularly frustrating because certain selections refuse to respond, or jump ahead two selections especially when using the mouse or keyboard. There are also quite a few descriptions still missing and/or are completely unhelpful. Also, there were a few times the BIOS would not come up after significant peripheral changes. USB devices stopped responding and Windows would hang. I’d like to see this remedied very soon if at all possible. This is definitely the opposite of their smooth and refined Hybrid UEFI BIOS which we still love.
Benchmark Suite Notes
Our benchmarks consists of programs that test the entire platform’s features and sub-systems using both synthetic and real world applications. For CPU and memory intensive benchmarking, I’m using CineBench, 7-Zip and Graysky 4.0 H.264 benchmarks.
For overall system performance benchmarks, we’re using PCMark07 at medium settings. Graphics benchmarks include 3DMark11, Batman Arkham City and Metro 2033. RightMarkAudio Analyzer is used to test the motherboard’s integrated audio processors. IO performance measuring things like SATA, USB and networking are also completed. And finally, I take a look at the quality of the motherboards looking for things like EMF, odd noises, crook components or software issues discovered in testing. Let’s get to work!
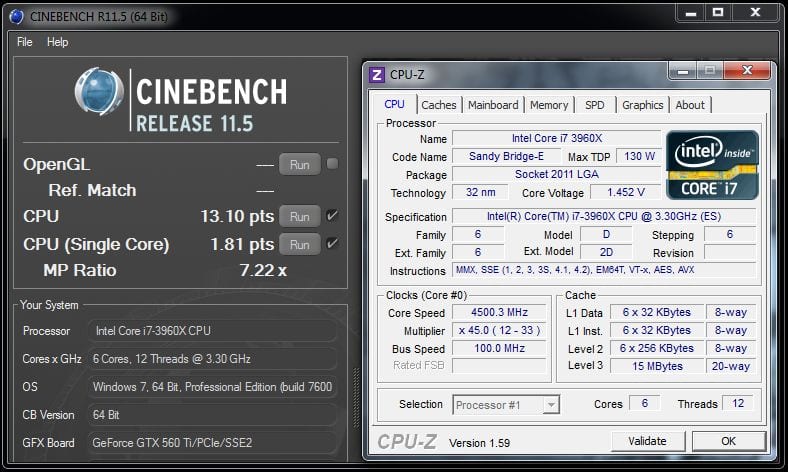
CineBench R11.5
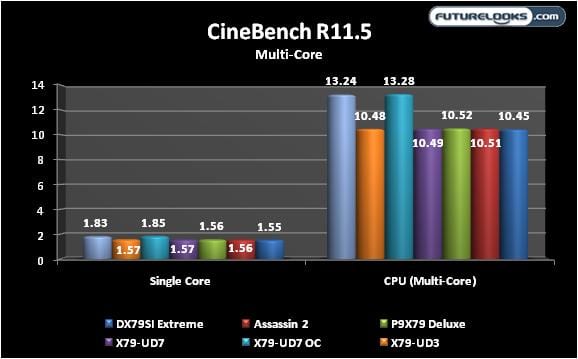
Starting off with CPU benchmarks, we start with some stock performance numbers. A couple overclocked results are included so you can decide whether or not overclocking is worth the effort. Personally, I recommend somewhere in the middle for long lasting components and for optimal stability.
7-Zip Benchmark
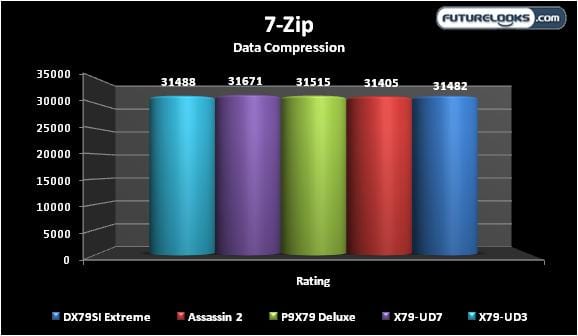
Using 7-Zip’s built in benchmark is about as easy as it gets. It uses a lot of the processing power to compress a bunch of data. The UD7 seems to have slightly stronger performance between the memory and CPU, pulling just ahead of the pack. BIOS tuning is often reflected here and can affect the results as shown here.
Graysky 4.0 Benchmark
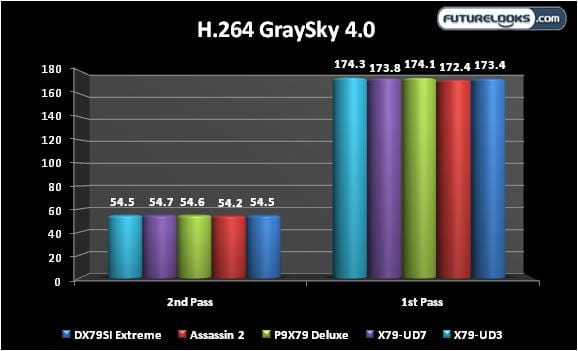
Graysky transcodes a video and gives us first and second pass series of scores. An average was taken from each pass. It’s interesting to see the UD7 pull just ahead on the average. Miniscule things like memory timings and CPU turbo performance greatly affect the frame rates. The UD3 just scoots ahead of the rest of the competitors.
PCMark7

PCMark7 tests the system’s overall performance. The only variable in this test was the motherboard so BIOS tuning plays a big part in performance as well as the overall assembly of the motherboard. The final PCMark scores are close but the Deluxe holds the high average with the feature rich Assassin 2 very close. The UD3 does well with the UD7 just behind.
Now let’s look at how the two boards do in graphics performance and games.