QuickBench
This benchmakr is probably one of the more thorough utilities for measuring transfer rates using 20 to 100 MB files using different sized 4 to 1024 KB data blocks. It also measures Sequential and Random performance.
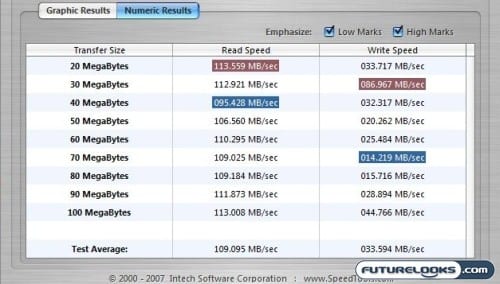
Again, the Value SSD gives us an idea of its odd nature thanks to the JMicron controller onboard. The Write speeds are particular all over the spectrum slowing down to 15.7 MB/s and then topping out around 87 MB/s.
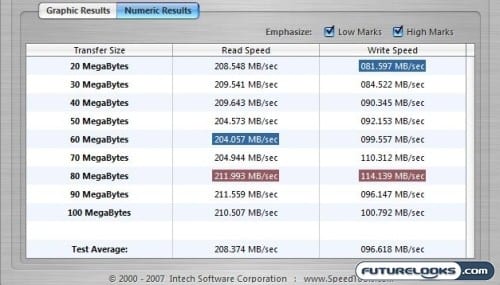
The Samsung controller equipped SSDNow V+ corrects the weird performance associated with its gibbled cousin. It provides double the Read Speeds and triple the Write Speeds! I know it’s Samsung, but this is a nice surprise.
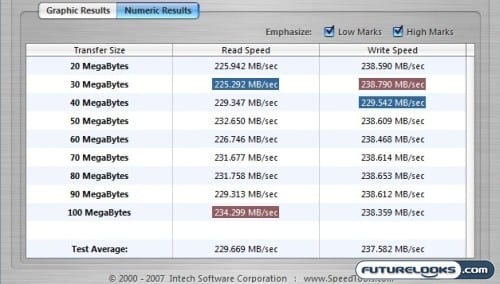
It’s interesting to see the TorqX’s performance as it gets loaded down with data. The Read Speeds aren’t enough here to matter compared to the V+ SSD. Its in the Write Speeds where the Indilinx tend to shine, topping out at a quick 238.79 MB/s.
Crystal Disk Mark
This benchmark is really simple and anyone can use it to benchmark their storage drives. There’s nothing complicated about it. It measures a couple major 4K and 512K data blocks as well as Sequential performance.
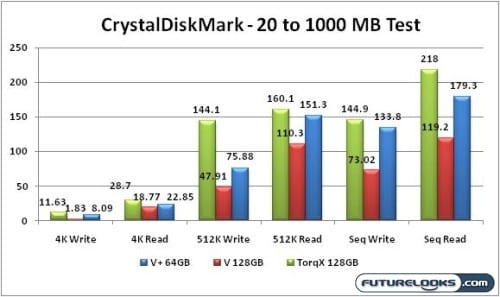
Alas, we see that performance is almost night and day between the Value and Value+ SSDs. The Samsung controlled V+ is quite noticeably faster. While 4 KB Write performance doesn’t appear to be any faster, there is a big difference between 1.83 MB/s and 8.09 MB/s. This would easily be noticed for end users that shuffle RAW photo files or MP3s.