

The introduction of the original AMD FM1 APU (codenamed Llano) was an innovation because, for the first time, a CPU maker treated the on-die GPU as an important piece of the silicon. And over the last 3 years, AMD has continued to refine the APU design with improvements in every aspect from generation to generation. The new Richland series looks to continue this trend and represents the first drop-in updates to the current FM2 socketed Virgo Platform. Lets breakdown the new APU to see if an upgrade is warranted over the previous generation.
What’s New
Firtstly, there has been no major change to the architecture of the new Richland APUs. Instead of building another architecture, AMD instead focused on refining of the current Piledriver design. Improvements include higher clock speeds, better power management, improved memory support, and also support for wireless displays. All this is packed into a chip that still works with the current FM2 socket.
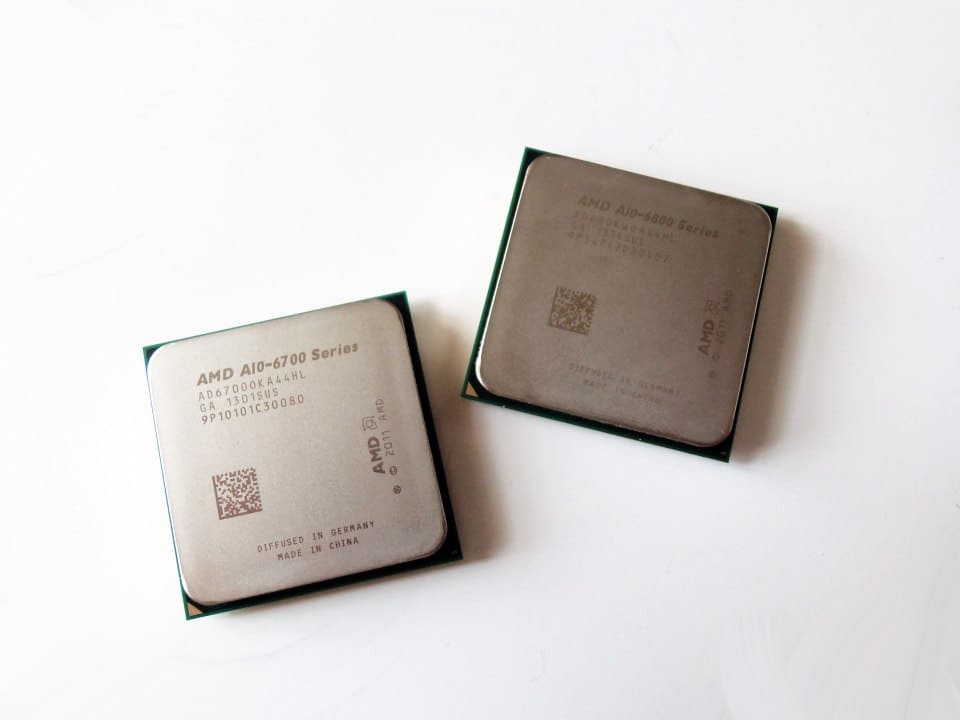
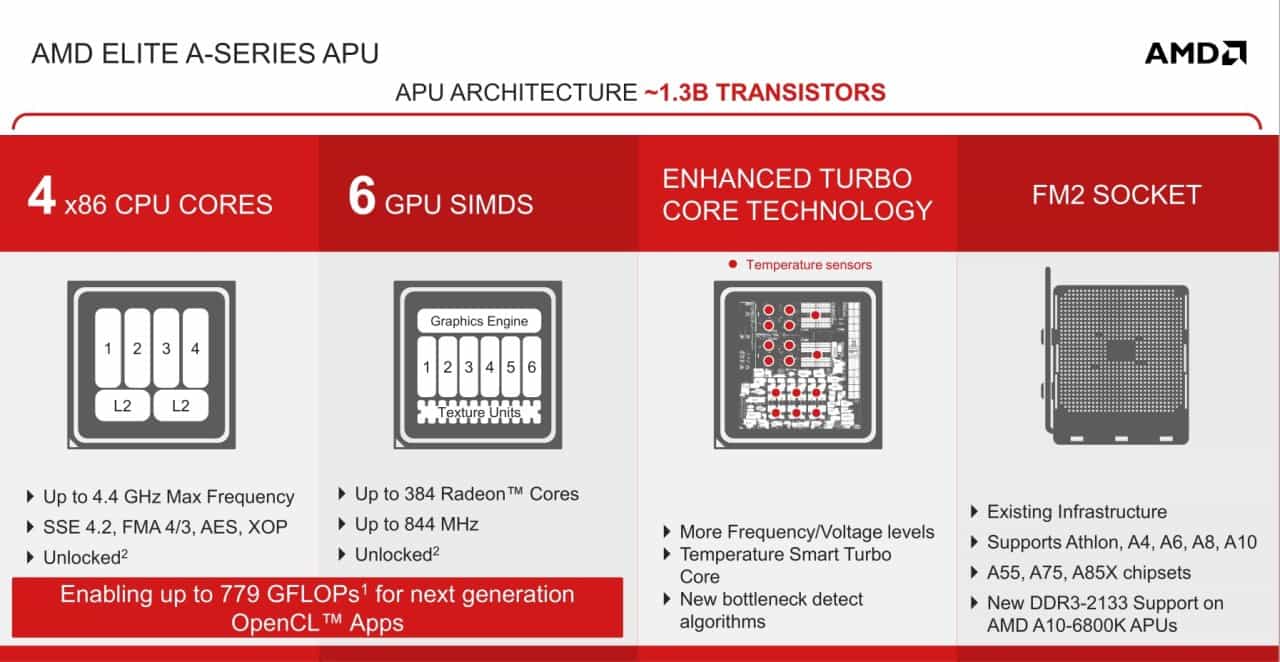
These A10 Elite A-Series uses the same 32 nm SOI manufacturing with the same 1.303 billion transistors, but utilizes them better. An internal temperature sensor is now apart of the package for more efficient power management through better frequency control. The power throttling applies to both the CPU and GPU portion depending on the workload for better performance in all areas.
The IGP is now supported by AMD Turbo 3.0 with a default clock speed of 844 MHz (44 MHz higher than previous generation) and turbo speeds of up to 950 MHz. This is directly tied to the overall TDP of the chip so it will affect how turbo is used with the CPU as well. The AMD Elite A-Series also now natively supports 2133 MHz RAM at 1.5 volts. The previous series could only operate with 2133 MHz RAM with inconsistent results.
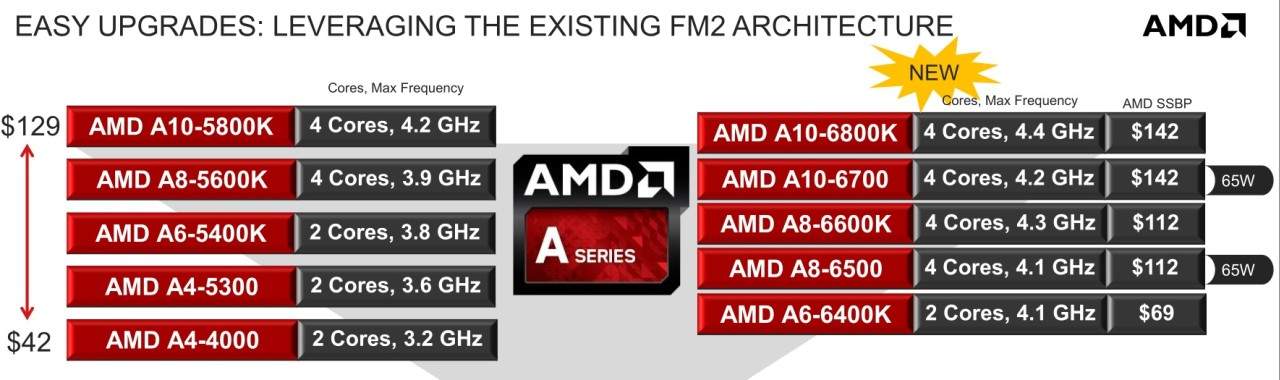
The A10-6800K and A10-6700 are priced at $149.99US and $148.99 US respectively which places them $20 above the A10-5800K. This price reflects the fact the Richland counterparts to Trinity chips are 200 MHz to 300 MHz higher in default clocks speeds and AMD Turbo clock speed. Lets take these Elite APUs and put them to the test against their predecessor to see how much of an upgrade they bring to the table.
Testing Setup
The test system this time around will be almost identical to review of the A10-5800K except for a change in the motherboard to my favorite from our previous FM2 motherboard round up. There have been a number of updates to benchmarking software and I will be using the latest versions of these. Note that the memory speed was 2133 MHz for both the A10-6800K and A10-5800K while the A10-6700 was limited by its on-die memory controller to 1866 MHz (9-10-9-27).
Hardware
- CPU: AMD A10-6800K 4.1 GHz (4.4 GHz Max Turbo)|| A10-6700 3.7 GHz (4.3 GHz Max Turbo)|| A10-5800K 3.8 GHz (4.2 GHz Max Turbo)
- GPU: on-die Radeon HD 8670D (6800K & 6700) || Radeon HD 7660D (5800K)
- CPU Cooler: Noctua NH-D14
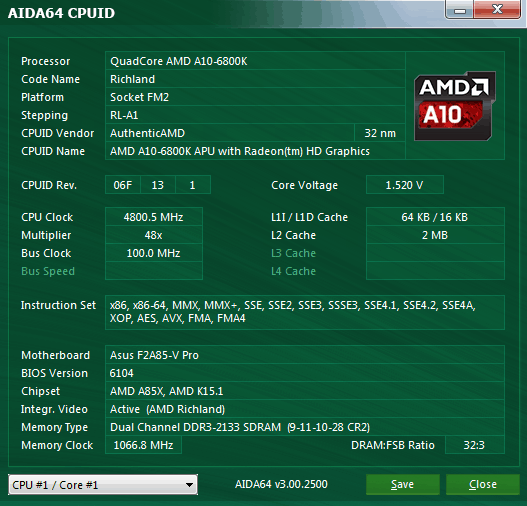
- Motherboard: ASUS F2 A85-V PRO (BIOS version 6104)
- Memory: G.Skill Ripjaws X 2133 MHz (9-11-10-27)
- Power Supply: Antec 850W HCP 80+ Gold
- Case: SilverStone TJ04-E
- SSD: Patriot Pyro SATA III MLC 60 GB (Sandforce 2281 controller)
- HDD: Western Digital VelociRaptor 1TB (10K RPMs)
Software
- Windows 7 Ultimate 64-bit
- AMD CCC 13.6 Beta 2 Drivers
- PCMark8
- 3DMark 2013
- SANDRA 2013 SP3a
- Resident Evil 6 Benchmark
- FRAPS
- Battlefield 3
- Metro: Last Light
- Cinebench 11.5
- 7-Zip v9.20
- Handbrake 0.9.9
Now we’ve got the software and hardware load out described, let’s see if there were any issues to note with installing and upgrading to the new Richland APUs!
Installation and Upgrade Notes
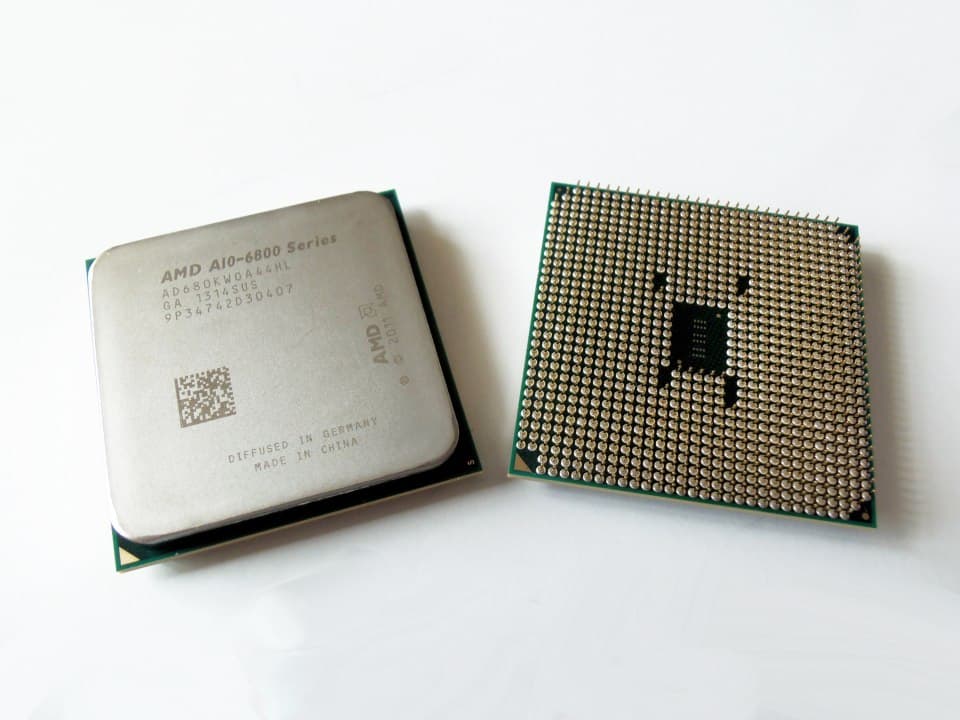
As stated earlier, the A10-6000 series is structurally the same as the the A10-5000 series and uses the same FM2 socket. This makes the A10-6000 chips a drop in upgrade for anyone with a motherboard using a current A55, A75, or A85X chipset. We highly recommend updating the BIOS for your motherboard prior to installing the Richland chips.
Once installed, the A10-6800K wastes no time impressing us with its overclocking ability. Let’s have a look at that next!
Richland’s Overclocking Potential
The CPU and GPU can be overclocked independently, but their shared power creates a kind of counter balance. Overclocking the CPU limits the GPU overclocking potential and vice versa. I easily got the CPU up to 5.0 GHz, but going any further decreased stability. I also got a GPU overclock up to just under 1100 MHz by locking the CPU to its default speed. Keep in mind this is with my usual overclocking prep of disabling any power management and turbo features.
The beauty of the A10-6800K’s flexibility is you can basically customize your overclock to fit your needs. If you need GPU power to get every frame out of a game, a faster CPU for tasks that demand it, or a balance for those who want a little of both. I opted for the latter with a CPU speed of 4.8 GHz and GPU speed of 950 MHz at 1.425V to get more out of every test conducted.
The story is very different with the A10-6700 as it is not an unlocked chip. You can still overclock the chip via bus clock, but it can be exceedingly difficult. What I found surprising is the memory controller was not able to operate with RAM set higher than 1866 MHz. In the past, every APU I tested could handle one multiplier higher than their specs but not this time. The listed 1866 MHz max RAM speed is set in stone.
Now that the chips have had a chance to show their full potential lets get into testing each to see where they stand today.
Total System Performance (PCMark8)
We begin with a total system performance test from FutureMark using their latest software. This should give us a good idea of the basic performance difference between the chips being tested and what we can expect going forward.
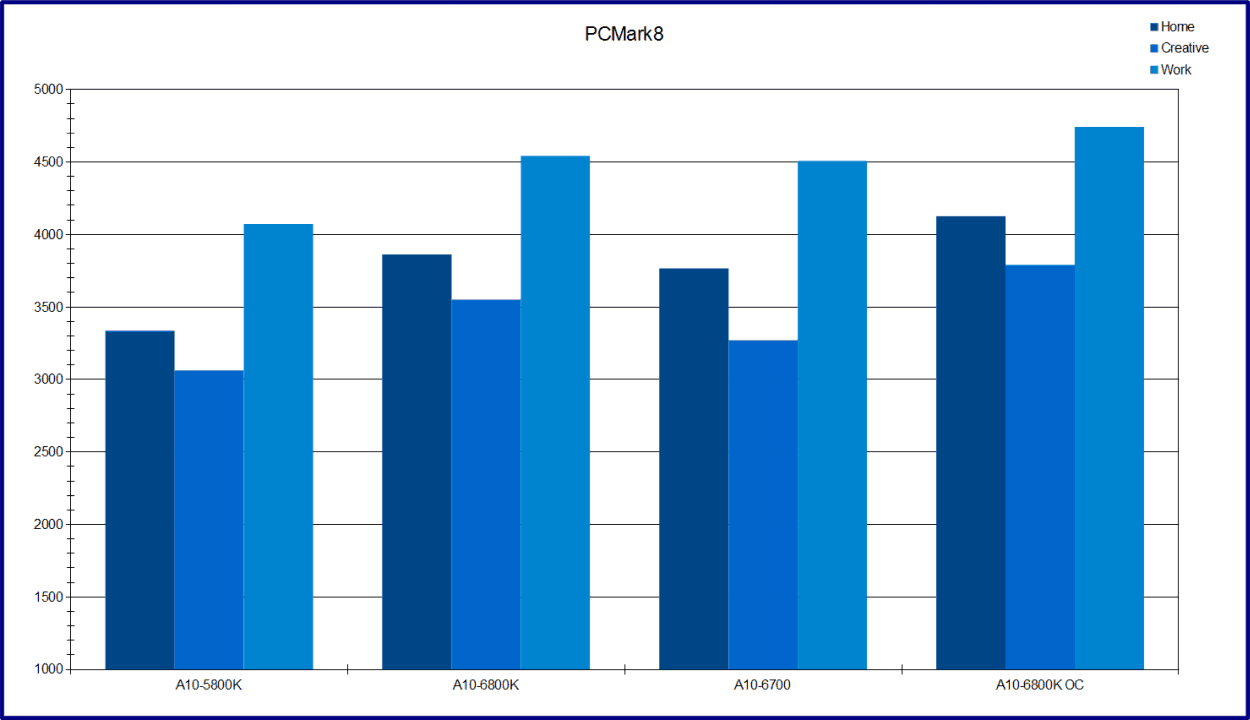
As you can see, the new AMD A-series Elite chips hold an advantage over the A10-5800K in all three categories. Even the A10-6700 has a distinct performance improvement with virtually identical clock speed at 100 MHz lower default and 100 MHz higher max turbo. This could be due to either the 65W A10-6700 being able to hold max Turbo longer due to the lower TDP or design improvements internally. Lets look deeper to find out which is true.
Synthetic Graphical Performances (3DMark 2013)
Lets move right into graphical performance with 3DMark. This should be interesting as the IGP is the only real difference. The new AMD HD 8670D supports Turbo boost and has a 44 MHz higher default clock speed. This means the 800 MHz HD 7660D on the A10-5800K has its work cut out for it with the HD 8670D at 844 MHz (950 MHz Turbo). We used the Fire Strike Benchmark which is normal for dedicated desktop graphics cards, to push the limit.
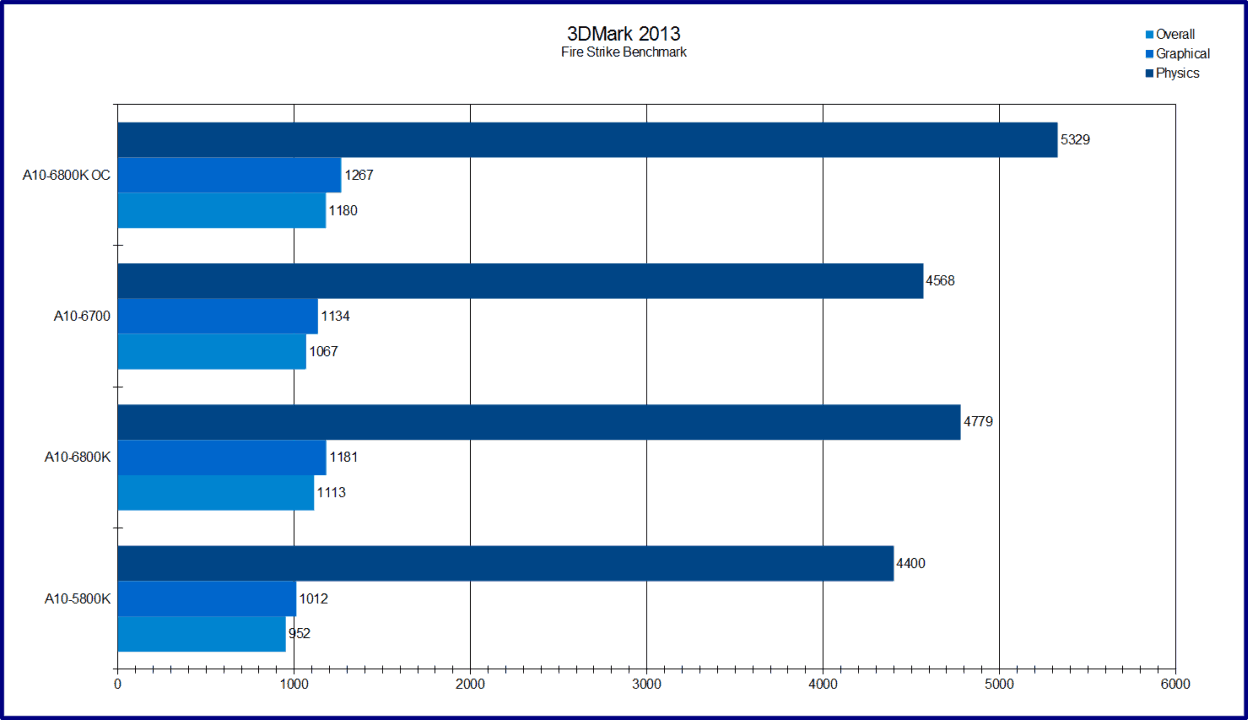
We know from past experience the AMD A-series APUs always have a good showing in graphics tests. Even compared against entry level desktop graphics cards. The A10-5800K is still left behind here by over 150 points in both overall and graphical performance. The overclocked A10-6800K adds an additional 70 point difference to that. I know AMD Turbo did not help with this score since the CPU is being taxed as well. It was never allowed to reach 950 MHz so lets see if we can get some use out of this new feature with a less CPU intensive test.
Simulated Gaming Performance (Resident Evil 6 Benchmark)
Now we will look at these APUs in a slightly different light with Resident Evil 6 using DirectX 9c. This test does not leverage the CPU nearly as much due to lack of physics. Instead the test focuses on GPU performance in a variety of environments ranging from small corridors to large areas filled with the undead. Tests were done at 1920 x 1080 with maximum graphical settings, no motion blur, and VSync disabled.
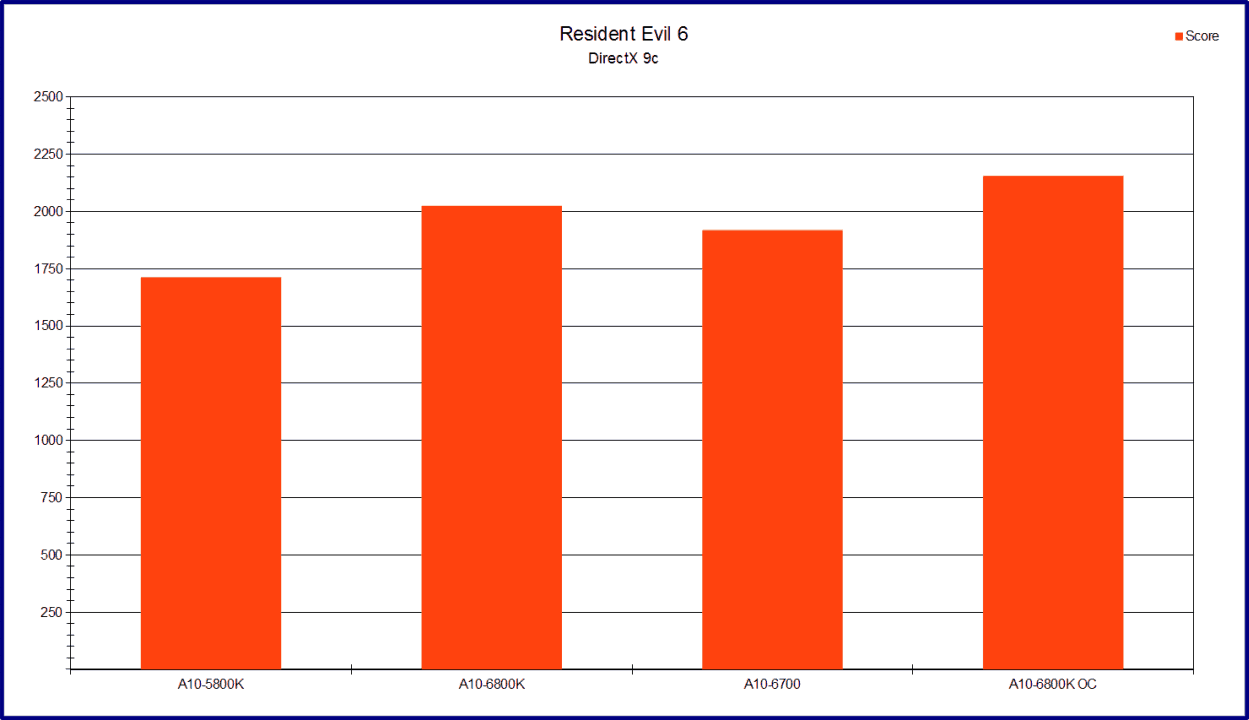
This time I believe it is clear AMD Turbo 3.0 was able to run the GPU at the 950 MHz turbo boost mode. Both A-series Elite APUs cruised pasted the A10-5800K with more than a 200 point advantage. The A10-6800K did maintain a distinct advantage over the A10-6700, but this could be due to the higher clock speed of the CPU.
Real World Gaming Performance (Metro: Last Light & Battlefield 3)
Finally we will put the IGPs from the AMD A-series Elite to the ultimate test in actual gaming. I tested these chips for both games at 1920 x 1080 using the game’s recommended settings. Metro: Last Light elected high quality, 0.5 SSAA, 16X AF, Low motion Blur, and Normal Tessellation. Battlefield 3 selected the High pre-set. We think both games are being a little ambitious with these settings so lets see how it worked out.
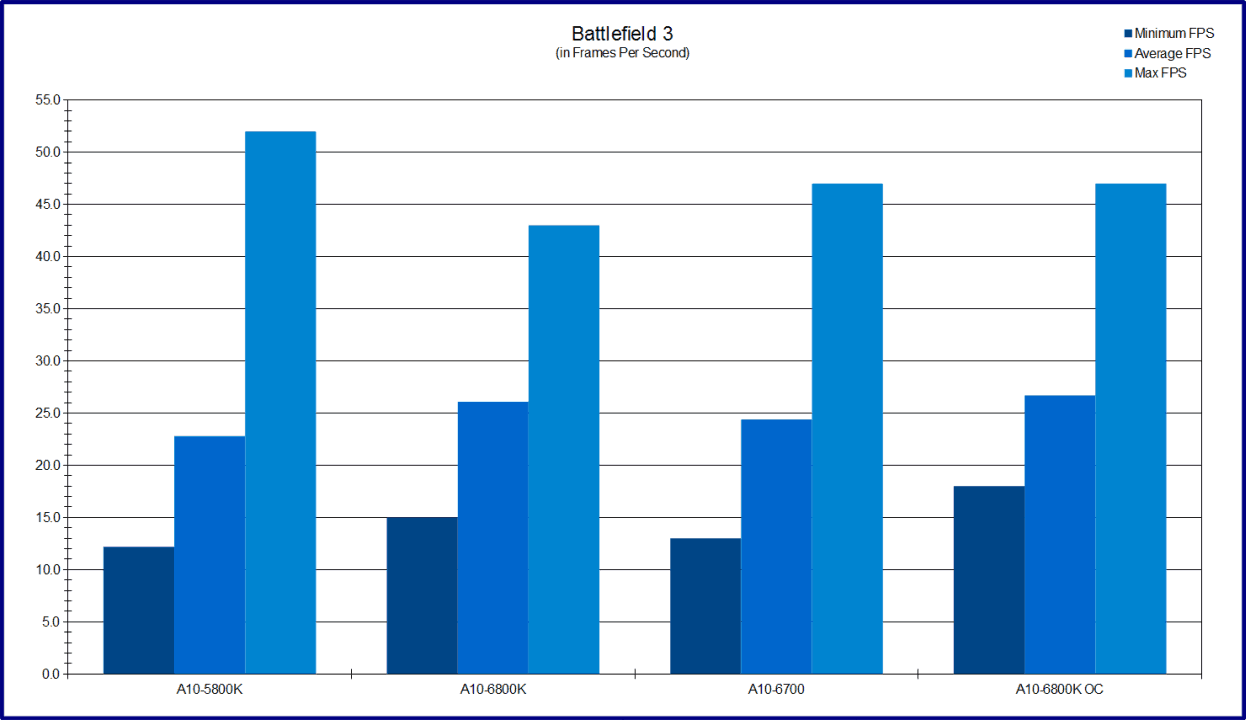
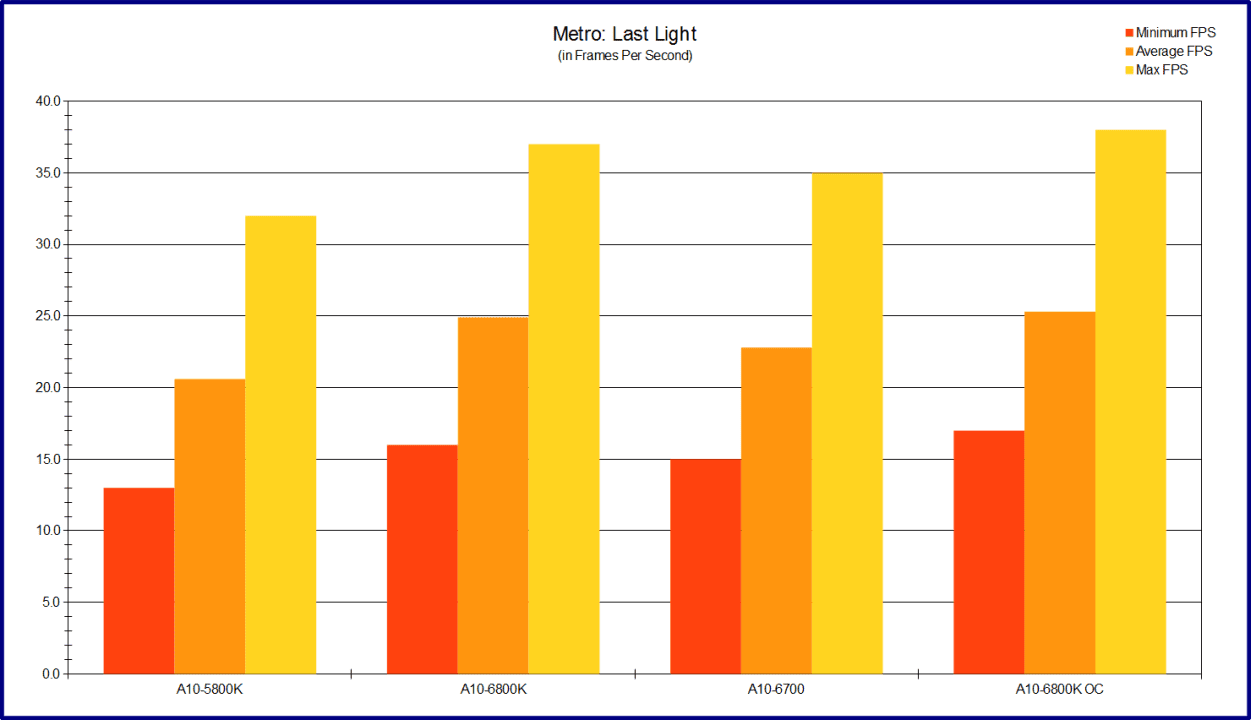
As expected, all three chips fail to hit 30 FPS which many believe to be the threshold for playable gaming performance. We believe the minimum FPS should never drop below 30 FPS for fluid gameplay. Interestingly, the overclocking of the A10-6800K had virtually no affect on average frame rate, but does improve minimum frame rate in both games. The A10-5800K didn’t stand a chance as it fell behind an average of 14%.
We can clearly see the performance is still not enough for such extremes, but has improved by a significant margin over the last generation. Both BF3 and Metro Last Light can be played well on an AMD A10-6800K or A10-6700 if you tweak the settings to be more reasonable. They could be disappointing to PC gamers, but could work as a hold over for those building on a budget. You can enjoy your current games while waiting to buy a dedicated graphics card.
Now lets isolate the CPU and see if it has improved. This should also help to narrow down if raw clock speed is the key to the graphical performance figures.
General CPU Performance (Cinebench 11.5)
Starting things off simple this time, lets look at integer CPU performance with Cinebench. Cinebench takes a smaller rendered image and then increases its size by re-rendering the image using the CPU to redo all the calculations on the fly. The final score is based on how many calculations are completed during a clock cycle.
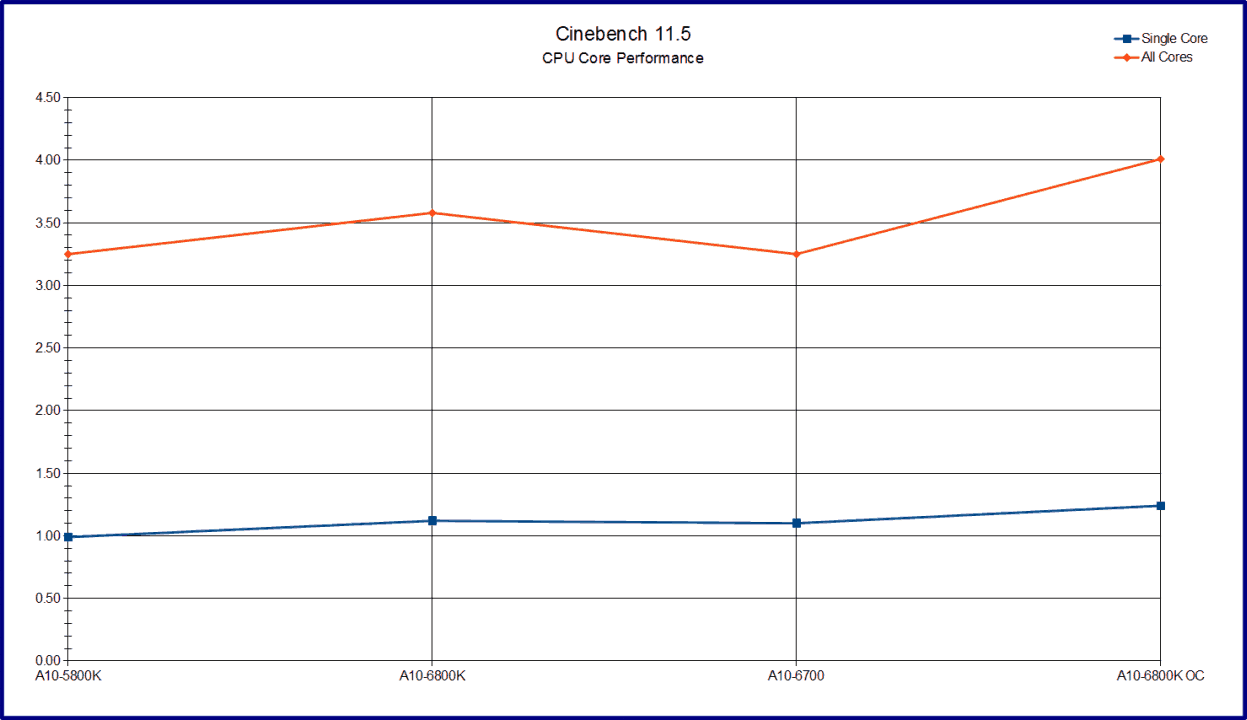
The clock speed of a processor has a large effect on performance here and this shows. The A10-6700 has the advantage in single-core testing thanks to its lower TDP helping utilize AMD Turbo 3.0 for longer periods, bringing its single-core performance on par with the A10-6800K. This is in-spite of a 100 MHz max Turbo disadvantage and lower memory speed for the 6700.
The multi-core performance is a different story since lower levels of turbo can be used, giving the advantage back to the A10-6800K. In this test, the 6800K puts a distinct gap between it and the other APUs thanks to its high 4.1 GHz default clock speed. Lets look a little further into the CPU performance.
SANDRA 2013 SP3a (Arithmetic CPU Performance)
We will now be using SiSoft’s Sandra 2013 SP3a to look at performance of the CPU in various tasks. These tests are designed to simulate heavy workloads of various kinds of math the CPU would see in real world programs. A great way to isolate various instruction sets as we have see in the past. First up is integer math like Cinebench and Floating point calculations.
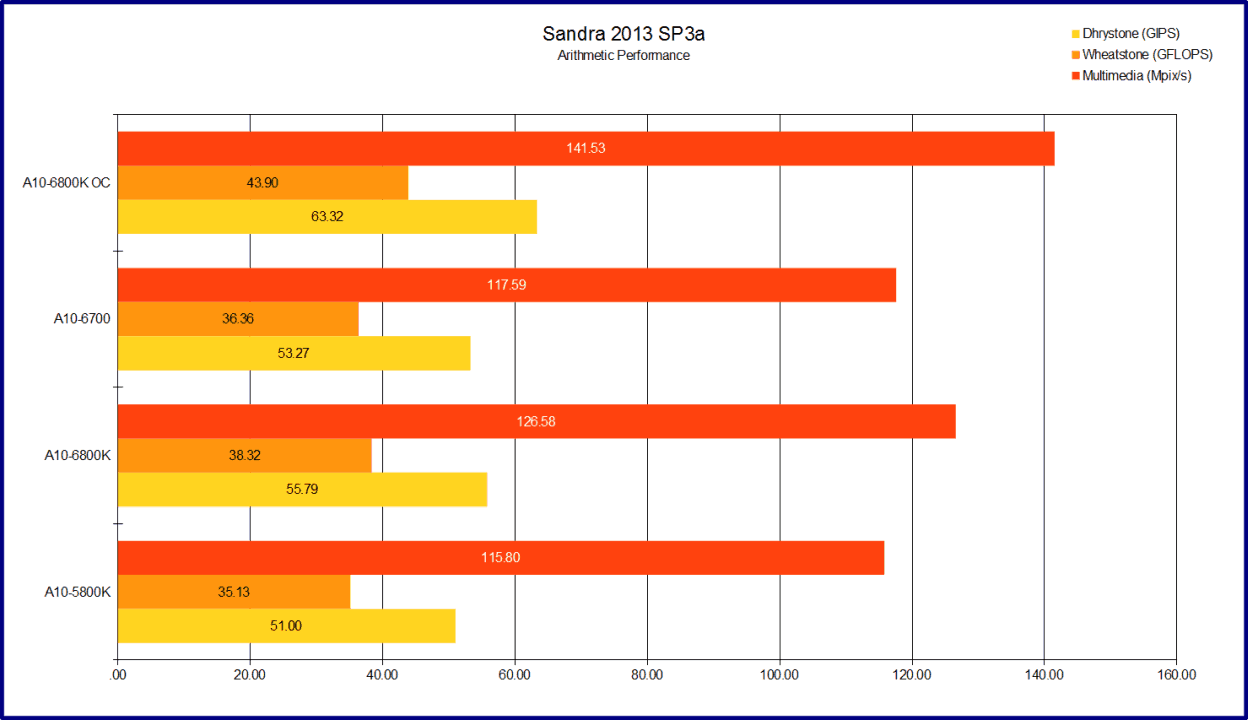
As expected the APUs fall right into line with this test. The 5800K, 6700, and 6800K taking their respective positions in that order. Overclocking the A10-6800K shows good improvement in every test. Lets move right on to the next test.
SANDRA 2013 SP3a (Cryptography Performance)
The next test focuses on Floating-point mathematics using the AVX and SSE instruction sets. In this case the Piledriver design has a dedicated FPU (Floating Point Unit) for this kind of workload. It consists of two 128-bit FPUs that can also work as a single 256-bit unit. The following test are 256-bit encryptions which means only two threads instead of the four other tasks would see.
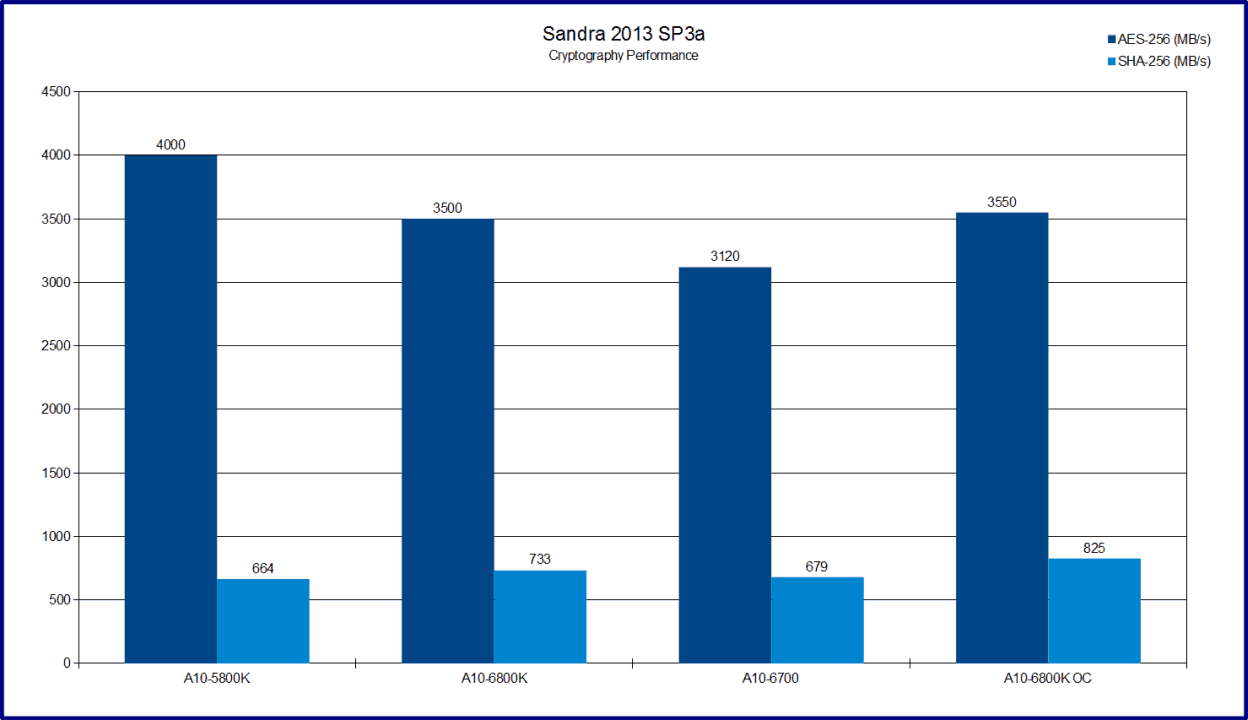
The A10-5800K finally finds a test it can shine in as it takes a huge lead in the Cryptography AES-256 test. This is clearly a fluke and likely not correct as it is the only test the 5800K comes out ahead. We believe this to be a coding issue that SiSoft will address in the next release. Overclocking here had very little effect on performance for the A10-6800K.
This also means the performance difference for the A10-6700 is not related to its clock speed as it comes out just barely ahead of the 5800K in the SHA-256 test and well behind for the AES-256. This means the lower memory speed must be hindering its performance. This being the case, lets look directly at memory performance and see how big of a different there may be.
SANDRA 2013 SP3a (Memory Performance)
The Sandra memory performance test is pretty straight forward and should provide some more information when comparing these APUs. The memory test is designed to see how fast the CPU read, write, and copy data to and from the installed RAM. Both the A10-6800K and A10-5800K are using the G.Skill RAM at its default speed of 2133 MHz (9-11-10-28) while the A10-6700 was unable to reach 2133 MHz speed. It instead is using the same RAM set at 1866 MHz (9-10-9-27).
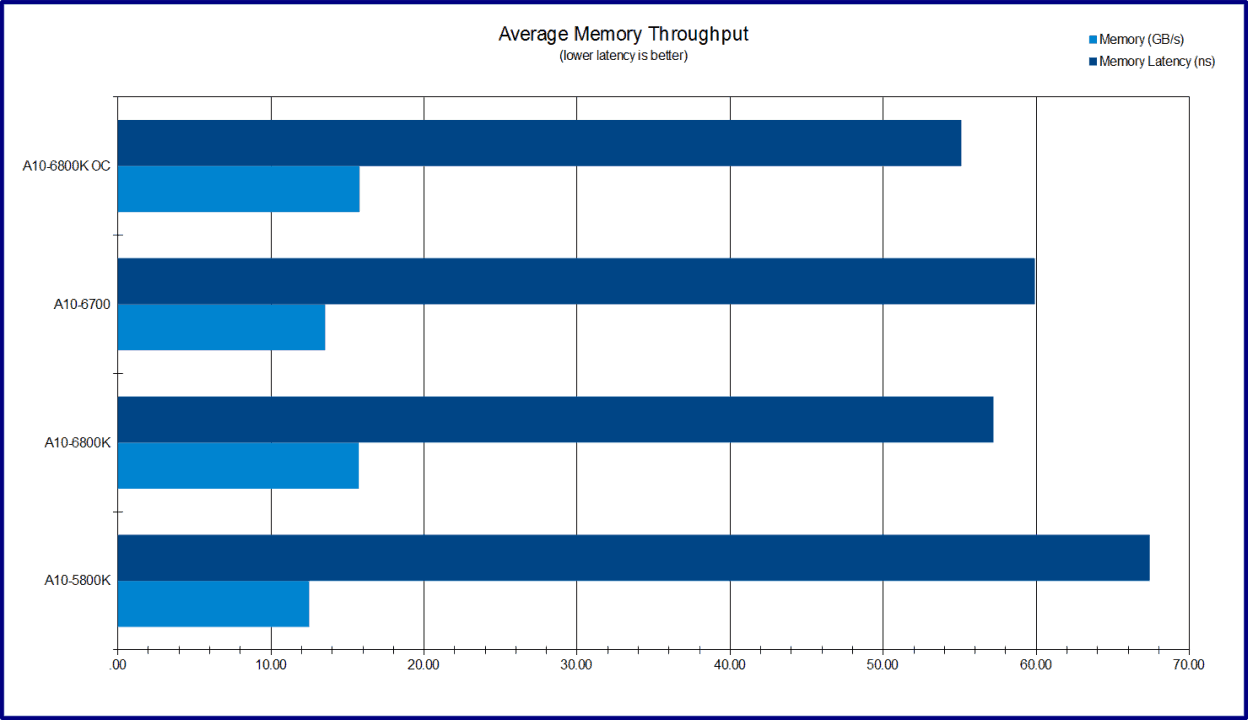
This proves very insightful as the A10-6800K has the lowest latency and highest average throughput. What is more interesting is that the A10-6700 has higher throughput than the 5800K with its higher clock speed. The memory controller on the new A-series Elite APUs many not have changed drastically, but they have clearly improved being designed to work with 2133 MHz RAM as the default.
Previously, AMD has bolstered stock of lower series chips by using higher-end silicon that failed to meet specs. I believe this is now being done with the memory controller as well. There is absolutely nothing wrong with this, but it would explain why I could not get the A10-6700 to run memory higher than 1866 MHz via a multiplier shift. FSB overclocking works, but I was clearing hitting a wall due to memory speed not CPU potential.
The A10-6700, even with memory speed being limited to 1866 MHz, does not limit its performance as it still comes out on top of the A10-5800K in every test. The difference in throughput is 1.04 GB/s with the A10-6700 at 13.54 GB/s compared to 5800K at 12.5 GB/s. Lets see how some real world testing where memory speed is a factor would separate the two.
Real World CPU Performance (7-zip 9.20)
This is another straight forward test you can find built into 7-Zip. It tests how many Millions of Instructions Per Second (MIPS) a system can handle. As we have seen in the past, this is affected by CPU clock speed and memory performance. The test is run with a 32 MB size test set.
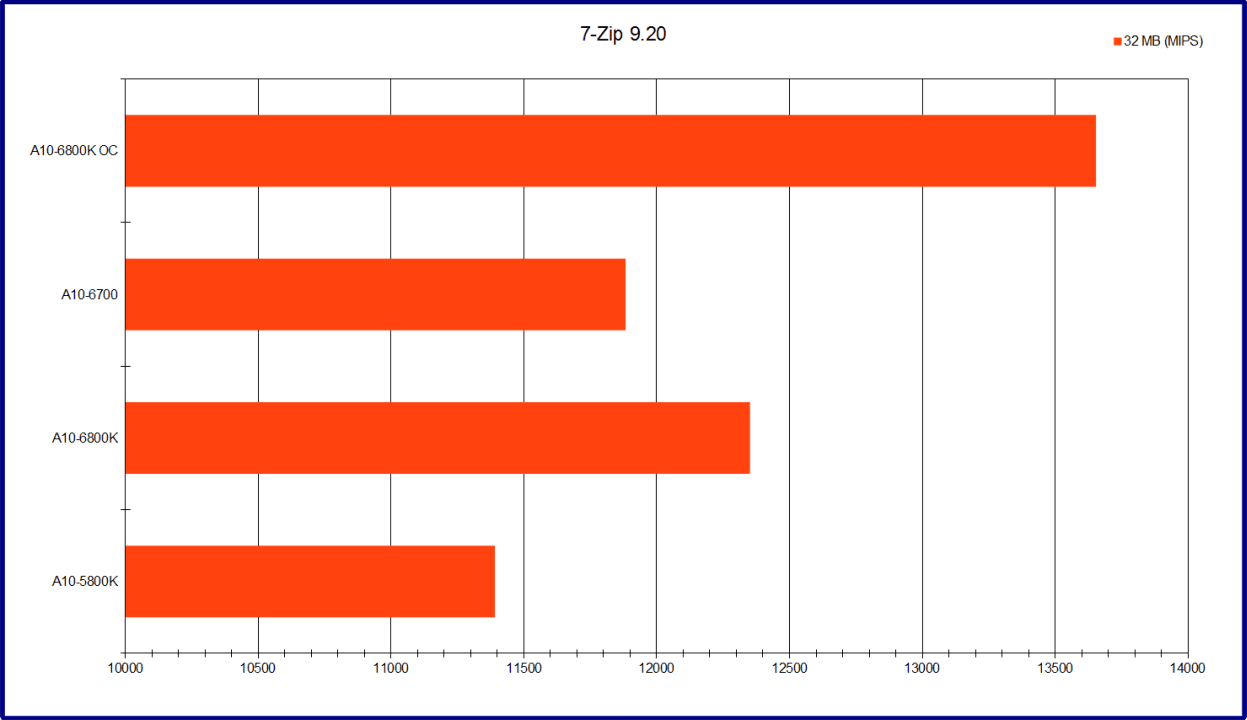
The A10-6800K, as expected, takes its place at the top of the heap leaving no room for error. It is clearly the superior processor with both the highest clock speeds and best memory performance. Interesting is the rather large difference between the A10-6700 and the A10-5800K. The 5800K has virtually the same clock speed and higher speed memory so it should be in the lead; however, memory throughput is what matters as the 6700 walks away from the 5800K in performance. Finally we will look at all this data in another practical test.
Real World CPU Performance (Handbrake 0.9.9)
Handbrake is a commonly used video converter program used by many including the Futurelooks Staff. In this test I will be taking a 5 minute 720p .264 HD video and converting it to fit an Apple iPhone. Memory throughput can affect results but it is very minimal. This test is focused on CPU performance where thread count and clock speed have the largest effects.
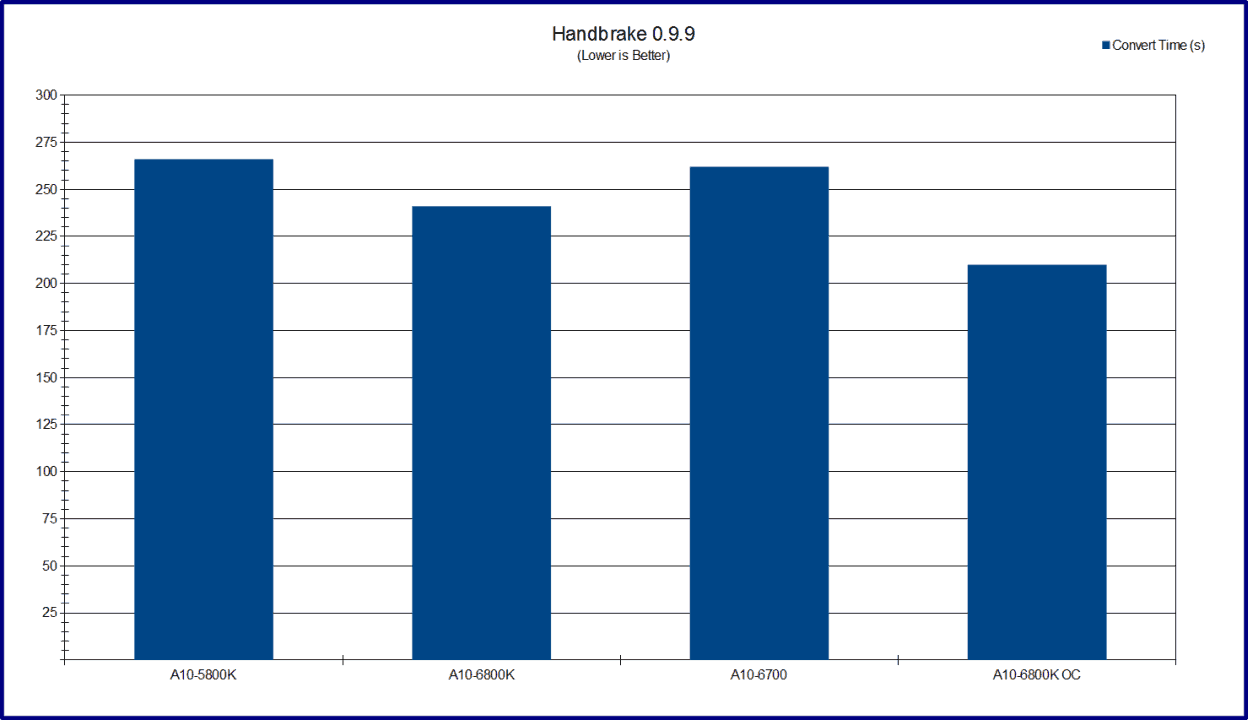
As you can see the A10-6800K moves into the lead by a just over 9% increase in performance when compared to the A10-5800K. Overclocking increases this even further up to 21%. The 6700 on the other hand is virtually identical with the conversion time being only 4 seconds faster.
Next, let’s see how power use factors in as we see how these APUs manage their power.
Power Consumption
Looking at the power consumption of the entire system during operations, since the only variable here is the APU being used, it will be the only thing changing the power consumption. I have also corrected for my Antec 850W HCP efficiency to get the most accurate wattage regardless of PSU being used. The end result should give us an idea of the amount of power you should expect for your system.
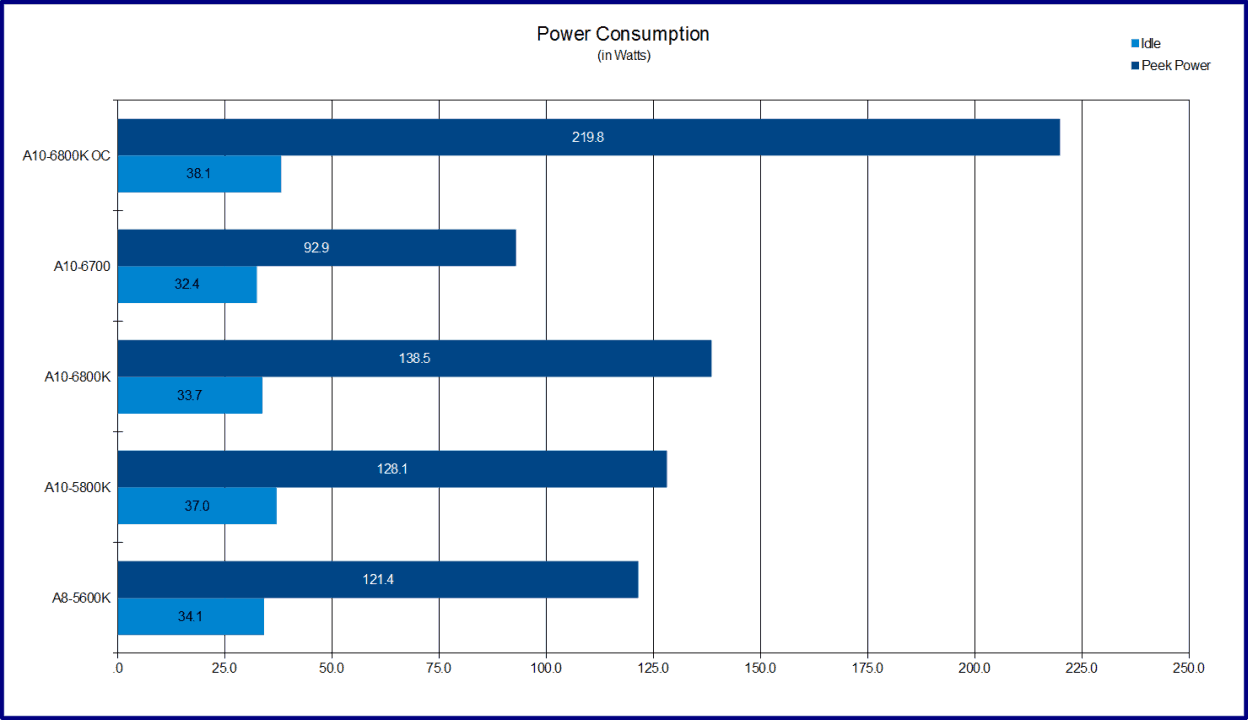
The two things that immediately jump out is when the A10-6800K is overclocked and the A10-6700 is at full load. The 6800K is no surprise when both the CPU and GPU sections overclocked, with no power management features enabled. However, it is the complete opposite story for the 6700 as it stays below 100W even at full load. Considering its overall performance this is quite impressive as it matches or out performs the A10-5800K while using 36 watts less power during full load.
The A10-6800K at stock clocks does use a little extra power at load, but comes in a few watts lower for idle to balance it out. Now that we have all the figures, we can finally summarize what the Richland APUs are all about.
Final Thoughts
We are glad to say that we are truly impressed with the new AMD A-Series Elite APUs for the most part. The new A10-6800K and A10-6700 show AMD can still get more performance out of the 32 nm silicon they are currently using. While this is good to see, AMD needs to move to a smaller manufacturing node soon to catch up with its prime competitor. I believe the A-Series Elite is just a stepping stone to their next big evolution with the APU design.
The AMD A-series Elite seems to be like the first APUs with AMD testing new grounds in the memory controller. It is clear they are working on improving throughput, latency, while offering better performance with higher clocked memory. If anything could benefit from better memory performance, it would be the A-series. Especially with rival Intel trying to catch up in the IGP department. This is one area AMD currently has no competition and they need to keep it that way.
Our only major issue is the use of new labels for an APU that is architecturally no different than its previous generation. For example, the FX series flagship CPU went from the FX-8150 to the FX-8350 and there were serious updates to the design with the new Piledriver architecture. The A-series Elite got an improved memory controller and high clock speeds, but gets re-branded as though they are an all new architectural design. While we can understand the marketing aspect, it doesn’t mean we have to like it.
The A10-6800K is priced at $149.99 US which is $20 higher than the A10-5800K parts still available on the market. But is it worth the extra money? Without a doubt it is. But not as a upgrade to an existing system. If you already have an A-series 5000 APU, then a dedicated graphics card would be a much better option for your money. The A10-6700, found at $148.99, is a much more attractive option due to its superior power management and lower TDP. Especially for a Small Form Factor build where both aspects are extremely important.
Directly compared to their predecessors, the new Richland 65W APUs should be the stand-outs for the A-series Elite and offer a lot of value for those building a new system on a budget today.
Pros:
- Flexible Overclocking
- Drop In Upgrade for the Virgo FM2 Platform
- Power Management Improvement for 65W chips
- Significant Graphical Performance Improvement
- AMD CrossfireX Support
- AMD AMP! Support
- AMD Turbo 3.0
Cons:
- A10-6700 Only – Limited Memory Speeds
- CPU Improvement mainly Clock speed related
Overall Score: 8.5 / 10.0


Help Us Improve Our Reviews By leaving a Comment Below!