
It is time to poke even deeper into AMD’s latest flagship processor, the FX-8150. We covered a lot of ground in Part 1 with our first impressions of the FX-8150 and the pieces that make up the new Scorpius Platform. In Part 2, we are going to see if you can narrow down some of the issue(s) highlighted in our first look, including a closer look at the spotty performance observed in the first piece. We are also going to turn the FX-8150 dial all the way up to eleven to see what kind of potential this new chip has. This is going to be a roller coaster ride of ups and downs so you might want to strap in tight.
Test System and Notes
All tests for the AMD system used the AMD Catalyst 11.10 Preview Drivers Revision 2. These were the latest drivers available from AMD at the time. I also consider the INTEL Core i7 2600k an eight core processor in these tests as the OS sees eight threads. While this is not reflected in the architecture of the chip, the same could be said of the Bulldozer design which does the same thing by redesigning a different portion of the chip than Intel.
I wanted to include tests with the FX-8150 running on the GIGABYTE 890FXA-UD5 to see if the difference in the chipsets really does boil down to SLI support and uniformity of features such as USB 3.0. Unfortunately, at the time of writing this review the BIOS intended to add support for the FX chips to the 890FX motherboard was not stable. I tried several different configurations, but could only get windows to boot 1 in 12 attempts. Once Windows 7 was running with my FX-8150 + 890FXA-UD5, I was greeted with BSOD after about twenty seconds. The BIOS was clearly not the final release version from GIGABYTE and not quite ready for public release.
As you know from Part 1 of this review, there are two turbo modes on the FX-8150. For the FX-8150 which has a stock speed of 3.6 GHz, the first turbo mode bumps all the cores up to 3.9 GHz. Max Turbo mode shifts half the cores up to 4.2 GHz. This is suppose to occur automatically when a CPU heavy task runs less than 4 threads and the shift is chip level. When I attempted to force this state by running 7-Zip benchmark affinity locked to 4 or less cores and the same number of threads, it would not go to Max Turbo. Max Turbo simply did not function during any testing.
**Update: There has been a recent update to the GIGABYTE 990FXA-UD5 BIOS, particularly the AGESA (AMD Generic Encapsulated Software Architecture) from version 0.9.2 to 1.0.0. Max Turbo mode does function correctly as of now.
AMD Test Systems
- CPU & Mobo: AMD FX-8150 with GIGABYTE 990FXA-UD5
- CPU & Mobo: AMD Phenom II X6 1100T with GIGABYTE 890FXA-UD5 (rev. 3.1 AM3+ socket)
- CPU Cooler: Noctua NH-D14
- GPU: HD 6850 1 GB Reference Card
- RAM: G.Skills 2 x 4GB @ 1866 MHz (9-11-10-28 CR1)
- HDD: Seagate Barracuda XT 2TB
- PSU: Antec HCP 850W
- Sound: Onboard Realtek ALC889
- OS: Windows 7 Ultimate 64-bit
- USB 2.0 Test: Corsair Flash Voyager 16 GB
- USB 3.0 Test: Rosewill 3.5 HDD Enclosure & Samsung Spinpoint F3 1TB
Intel Sandy Bridge Test System
- CPU: Intel i7 2600K @ Stock
- Motherboard: GIGABYTE G1 Killer Sniper 2
- GPU: ZOTAC Geforce GTX 560 Ti
- RAM: Patriot 4GB 2000MHz DDR3 @ 1866MHz (9-9-9-27) & 1333 MHz (9-9-9-27)
- PSU: Antec CP-850
- HDD: Seagate Barracuda 7200.11 500GB SATA2
- OS: Windows 7 Professional 64-bit
Software
- PCMark07
- 3DMark11
- CineBench 11.5
- Sandra 2011 SP5
- Alien Vs. Predator DX11 benchmark
- Resident Evil 5 DX10 benchmark
- Metro 2033
- Deus Ex: Human Revolution
- CrystalDiskMark 3.0.1
- 7-Zip
- wPrime
- Handbrake 0.9.5
- OCCT
- FurMark Burn-in
- FRAPS
- Windows 8 Dev. Preview
BIOS and Overclocking Notes
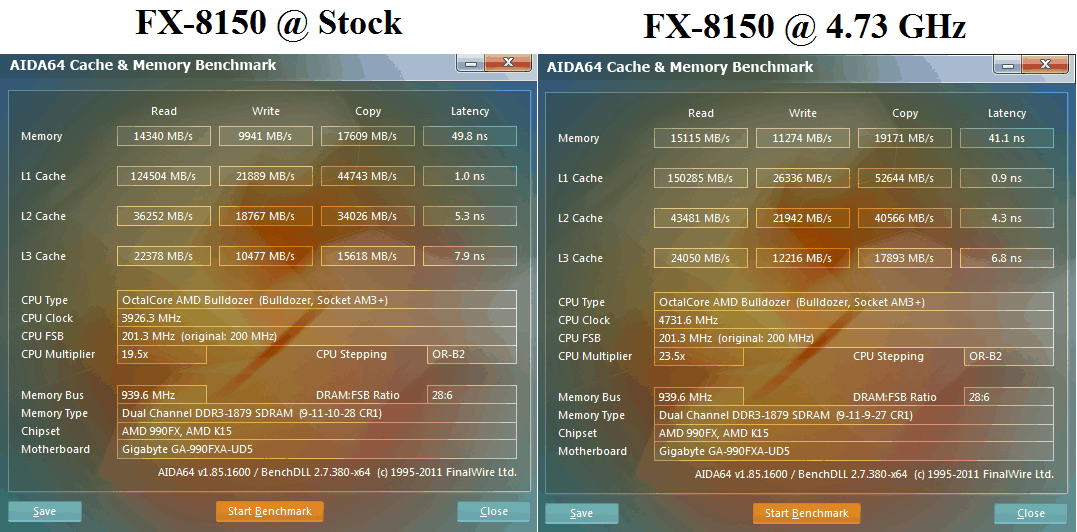
Overclocking the FX-8150 is much more like an Intel chip than the last few generations of AMD processors. I started by simply changing the clock rate of all cores to 4.2 GHz. While normally reserved for only half the cores in Max Turbo mode, all 8 cores ran at this speed with no issue. After confirming the stability at 4.2 GHz, I moved the processor up to 4.5 GHz. At this clock rate I needed to alter the CPU voltage from 1.425V to 1.45V for stability. After some voltage tweaking to the CPU, PLL, Northbridge, and HyperTransport, as well as remembering to turn off AMD Cool & Quiet, I got my FX-8150 stable at 4.73 GHz.
I attempted to move up inch by inch at this point but immediately ran into stability issues. I was capable of getting Windows 7 to boot normally at 5.2 GHz at a CPU voltage of 1.525V. While the system would start, any load on the CPU would blue screen my test system. After further tweaking and bringing the CPU voltage back down 1.5V, I could actually complete some short benchmarks, but it was still not stable.
My FX-8150 is only 100% stable at 4.73 GHz on air cooling in a voltage range I am comfortable with. I have a few friends using Phase Change cooling who have gotten stable testing done at 5.5 GHz, but it required voltage numbers that made my skin crawl.
I also attempted to overclock using the bus to gain RAM speed, but I found I hit a wall on the bus fairly early. At only 215 MHz bus, I need to increase voltages in several areas. I was content to leave the bus at this speed and continue with the standard multiplier overclock, but I could not get my system stable above 4.4 GHz at this point. We saw in Part 1 of this review the CPU processing power in single threaded applications needed the most help, so I opted for the overclock that provided the highest core speed. We will have to come back to this in the future for a closer look.
PCMark07 – Total System Performance
PCMark07 is a simple way to get an idea of your total system performance. This time we will including the overclocking numbers and an Intel Sandy Bridge system for direct comparison. Please note the GTX 560 Ti is a much better graphics card than the HD 6850 used in the AMD systems.

As you can see there seems to be a strange software glitch in PCMark07 software. I checked individual test results for the overclocked FX-8150, which can be seen here, to compare to the FX-8150 stock results. The results from each individual test showed better uniform performance when overclocked, but the final score did not reflect this. It is clear the software just failed to calculate a final score for each area except for Computational testing.
In the Computational results we can see the 1100T falls behind the FX-8150. Once overclocked to 4.73 GHz, the FX-8150 bests the i7 2600k using recommended memory speed by a mere 337 points. When both the FX and i7 are at 1866 MHz, Intel pulls ahead by 255 points. In this particular type of workload, AMD cannot match the Core i7 2600k without a bit of trouble.
3DMark11 – Synthetic Gaming Performance
This test will show what you can expect in general from an FX-8150 in a gaming environment. Since this test is very GPU centric, I will not included the Intel System results as the 560 Ti is much more powerful than the HD 6850.
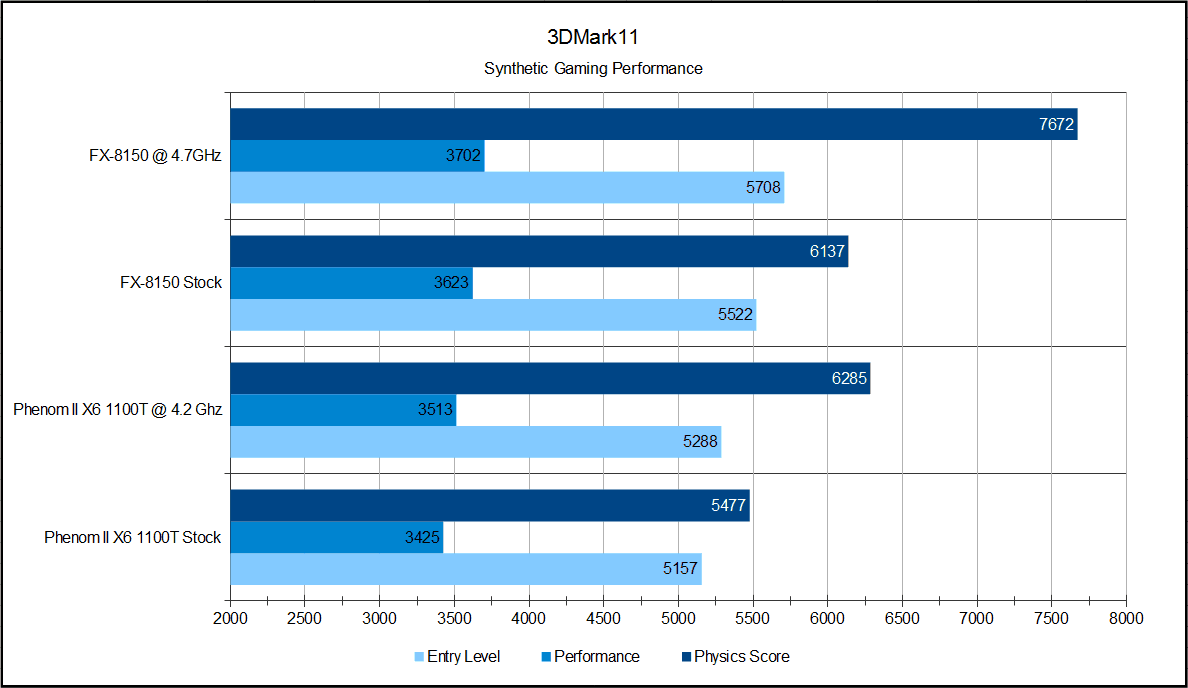
Once again the FX-8150 is ahead of the 1100T by a very comfortable margin. Even with the 1100T at 4.2 GHz, it falls just short of the FX-8150 at stock. The gap only grows larger as the FX-8150’s clock rate increases. This should mean the FX is a better choice in gaming, but we already know this is not true for all titles. In heavily threaded games or games that need a lot of software physics, the FX-8150 should pull ahead.
wPrime – CPU Performance on Old Programs
I want to start CPU specific testing with wPrime. It’s a test commonly used by the overclocking community to test the stability of their systems. In this case, we will simply use it to test performance of the FX-8150 on older software using very dated instruction sets.
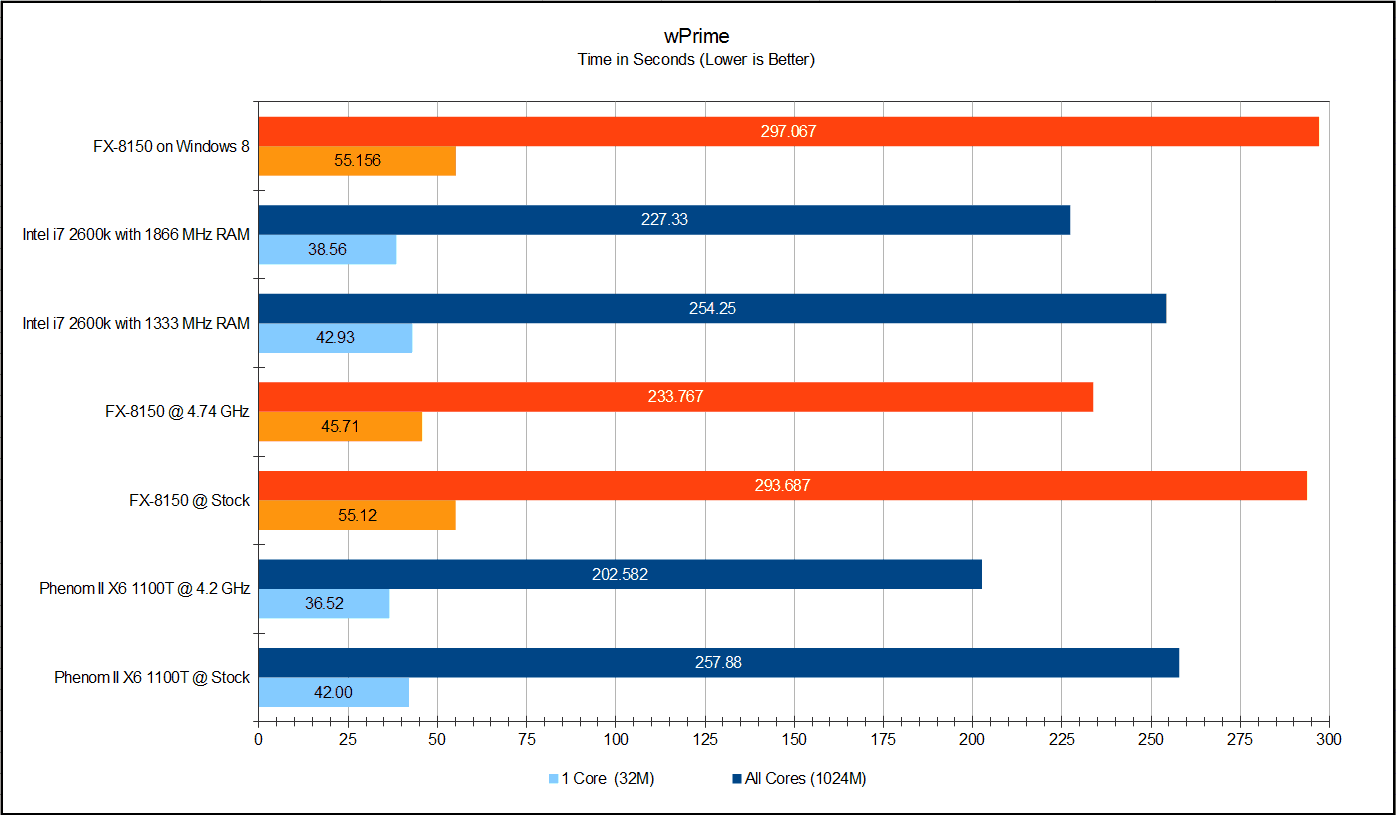
This is not a very good test for the FX-8150 as the results show it coming in last behind both the Intel i7 and the AMD Phenom II. Even when overclocked to 4.73 GHz, it has a hard time keeping up in multi-threaded test. The overclock is still not enough to help the single thread test here. We will look into this performance issue further a little later in the article.
Cinebench 11.5 – CPU Rendering Performance
Cinebench 11.5 is designed to test a CPU’s 3D rendering capabilities. Much like the above test with wPrime, I am trying to narrow down specifically what tasks the FX-8150 loses performance. This should help narrow down if there is an issue with how software is handled by the FX-8150, or if the integer cores are simply weaker than previous generations of AMD chips.
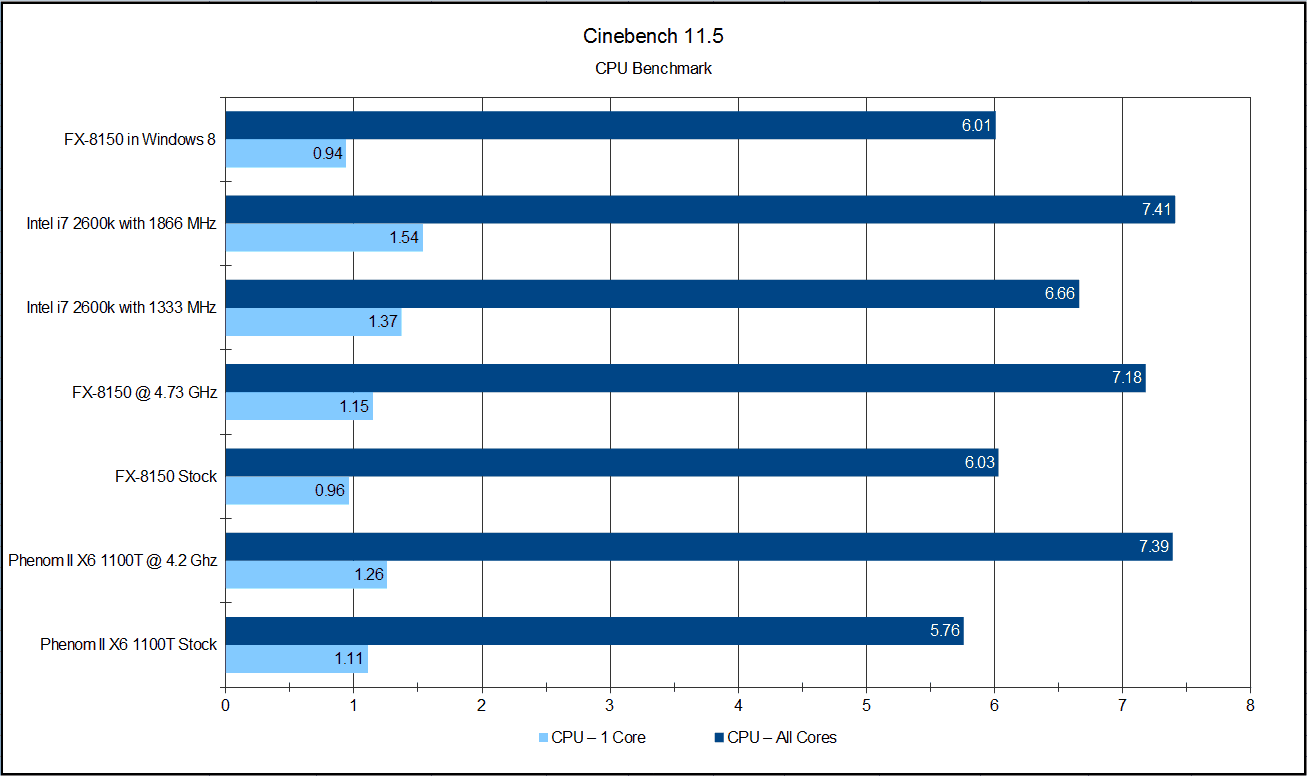
The FX-8150 single thread test reflects our previous two test with a lower performance than the other two chips. The multi-thread test for the FX is 6.28 times better. Since ideal would be 8.0 this gives us an efficiency of 78.5%. The 1100T is 5.19 times faster or 86.5% of its ideal and the i7 2600k is 4.86 times faster or 83.25% of its ideal performance. This is not a good sign as the FX-8150 appears to be less efficient than previous generations of AMD chips. It is also being out performed in rendering by a chip with two fewer cores.
Sandra 2011 SP5 – CPU Performance
We will now move on to testing different portions of the CPU itself to see where this performance issue is found in the hardware. Sandra 2011 is a collection of several benchmarking tools I will use to focus on CPU performance and the on-die memory controller. I am including my test results for Windows 8 Dev. Preview in all the Sandra benchmarks. The first test will be the memory bandwidth and efficiency.
The first set of CPU tests is the Dhrystone ALU test which is a program small enough to fit in the CPU cache. It is mainly focused on tested the raw horsepower of the integer cores. The second test is the Whetstone iSSE3 benchmark which is as old as the Algol 60 programming language (1972). This test is focused on the performance of the FPU portion of the processors. The multimedia testing centers around the MMX and SSE instruction sets. This means the multimedia test is the only one that focuses on how well the instruction sets are utilized and not the power of Bulldozer.
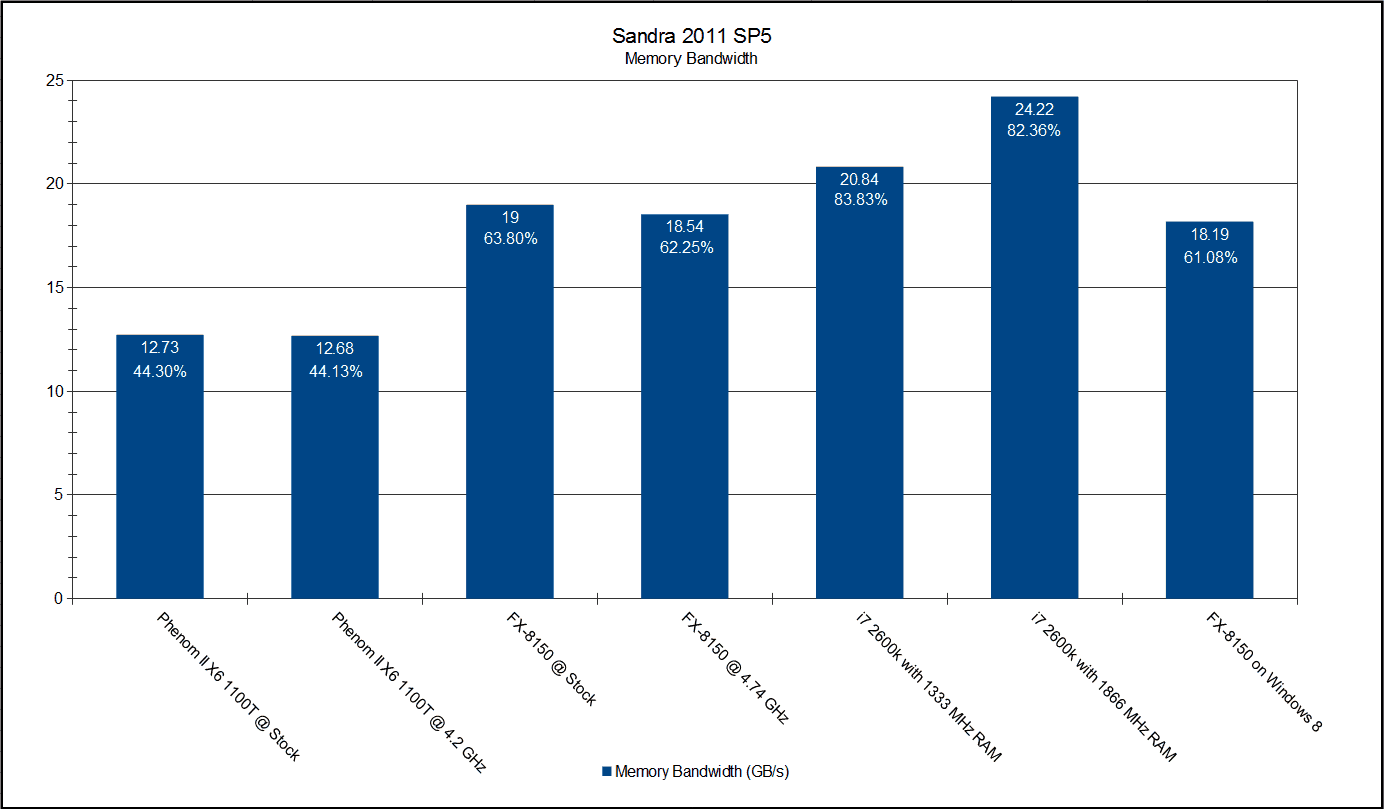
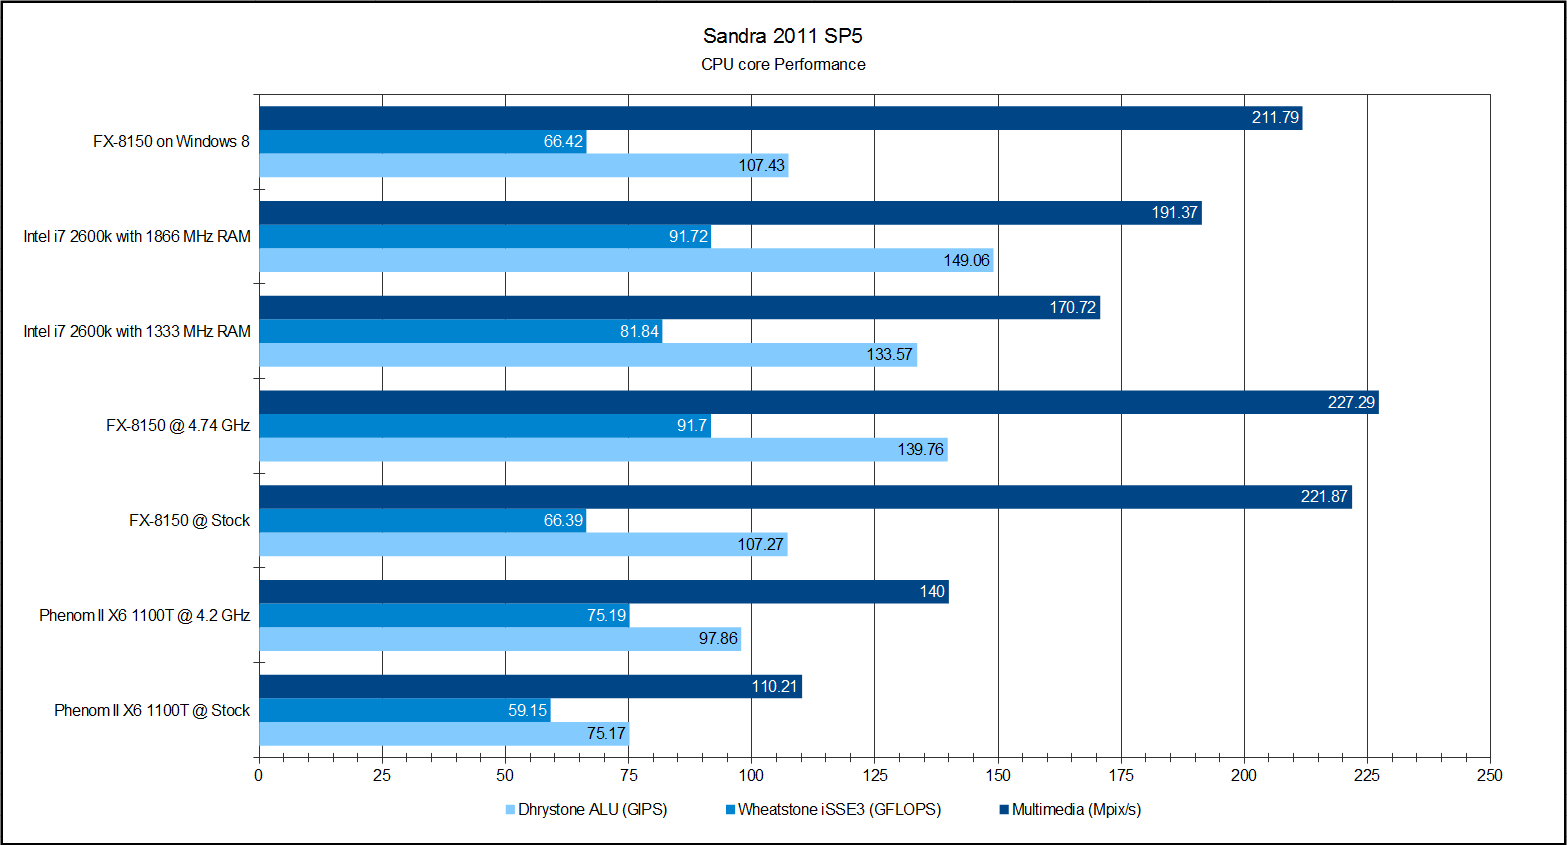
The reason I started with the memory test is that a lot of CPU heavy tasks involving large scale number manipulation. They are often limited by memory performance. As you can see, there are very distinct jumps in memory performance and efficiency going from Phenom to Bulldozer to Sandy Bridge. This same pattern is carried over to the Dhrystone and Whetstone tests. As memory performance increases, so do the performance of these test results. This does not hold true for the Multimedia test where the AMD FX-8150 holds the top spot. This is expected as the benchmark is optimized for an AMD Athlon using the MMX instruction sets as a baseline of comparison.
The Cryptography tests (SHA and AES) test the processors encryption and decryption abilities. Note the Intel i7 and FX-8150 have the AES instruction set and as you saw in Part 1, the 1100T will not even be close in this test. the SHA testing does not have specialized instruction sets, so its results should be very different.
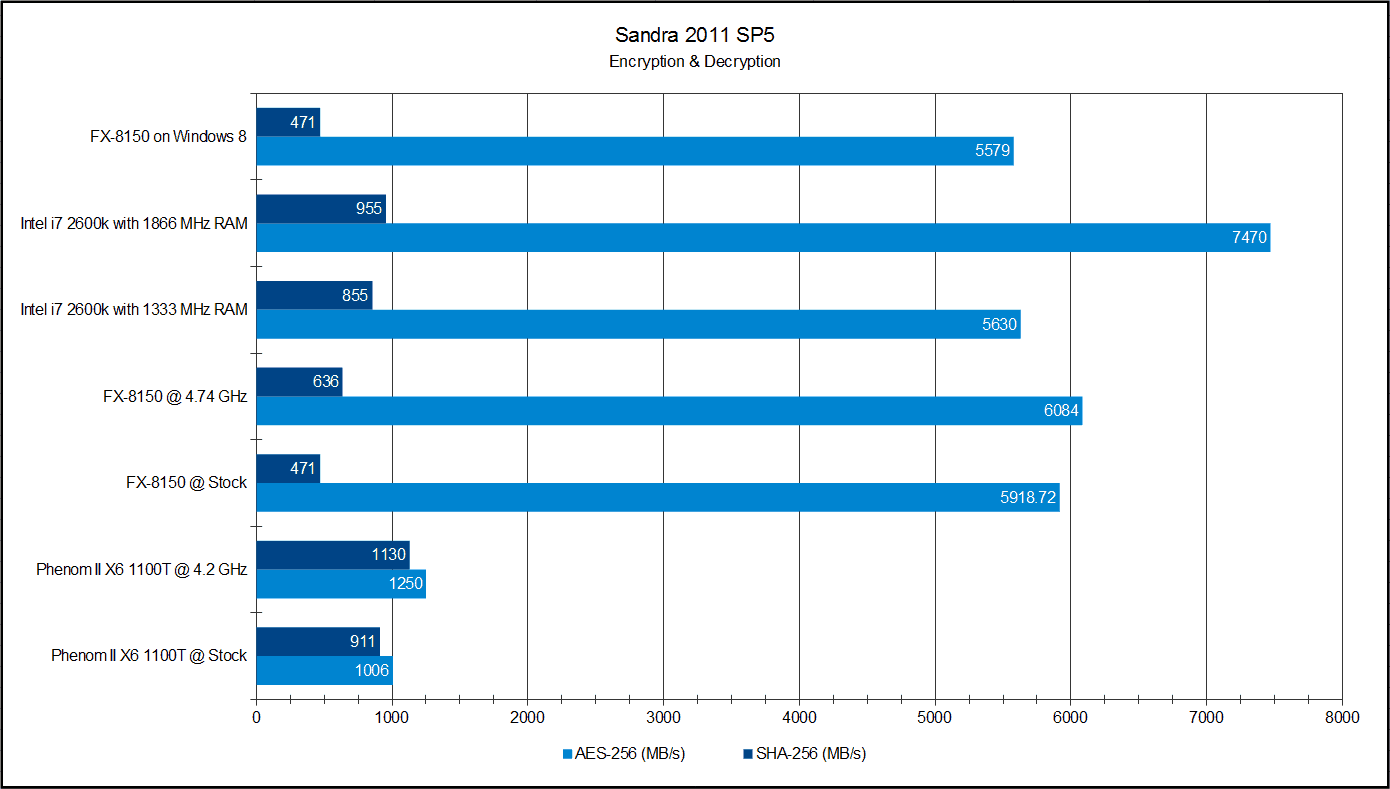
The Cryptography test proves the most unusual result. The FX-8150 drags its heels in the SHA-256 test falling well behind even the 1100T. The AES-256 test on the other hand, is unfair to even include the Phenom II 1100T as it does not have the AES instruction set. The FX-8150 does well against the i7 2600k when both use their recommend memory speed, but the 2600k pulls well ahead when both are using 1866 MHz memory speed.
The results clearly show this test is limited by memory speed. Even when overclocked by 830 MHz, the FX-8150 gains a measly 2.72%. This is one test where the bus overclocked (which would have give a memory speed of 2006 MHz) would have been the better choice.
7-Zip & Handbrake 0.9.5 – Real World Computational Performance
We will start the real world testing with 7-Zip and Handbrake. These are free applications that perform some very common tasks for Internet savvy people. 7-Zip is a free open-source archive program designed to open compressed and/or encrypted data files. Handbrake is another open-source program that re-encodes common video files from one format to another. It is commonly used to convert video files on a computer to formats for portable devices such as smart phones and tablets.
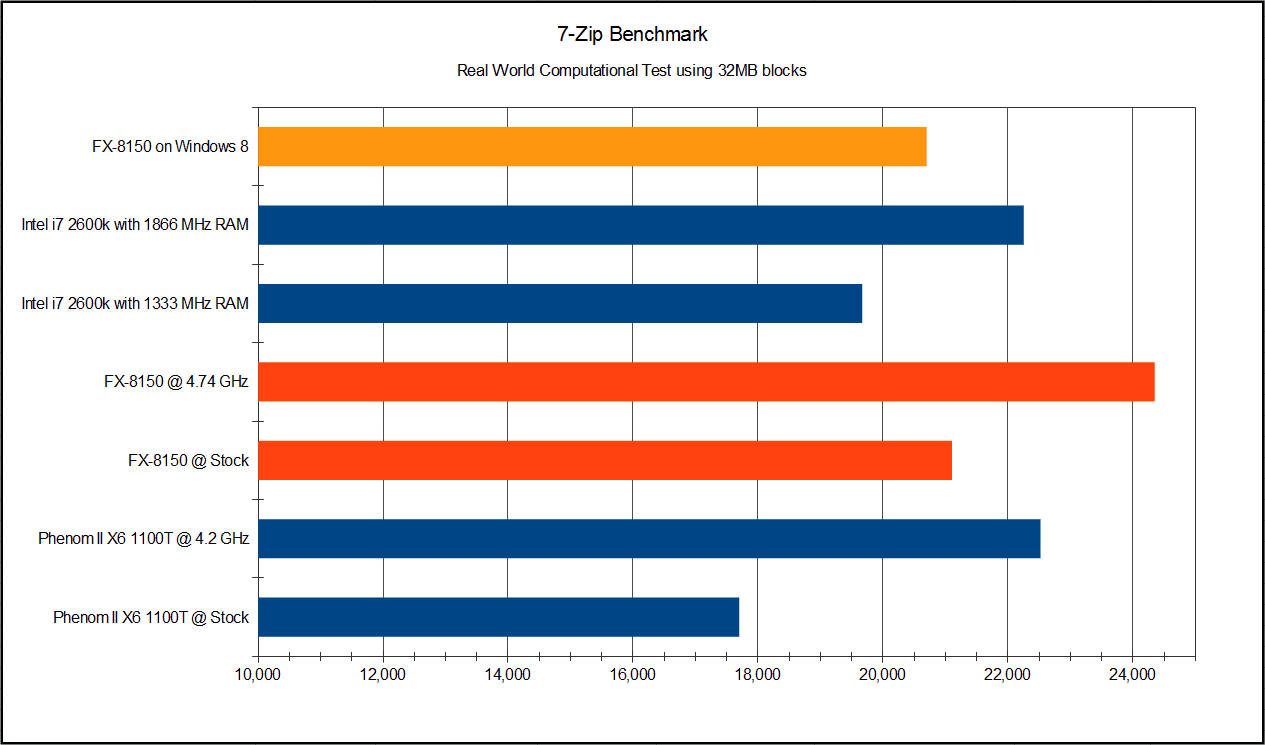
7-Zip is a well maintained program and always runs the most optimized code paths, so performance in this benchmark comes down to how well each chip handles it. This is clear as the FX-8150 maintains a lead over the 2600k with 1333 MHz RAM. When RAM speed is equal, the i7 2600k pulls ahead by about the same margin. Even though memory speed can affect this test, so can raw CPU power as overclocking provides uniform performance increases across all processors. It also puts the FX-8150 at 4.73 GHz in the top spot as it has the highest clock followed by the 1100T at 4.2 GHz with the second highest clock rate.
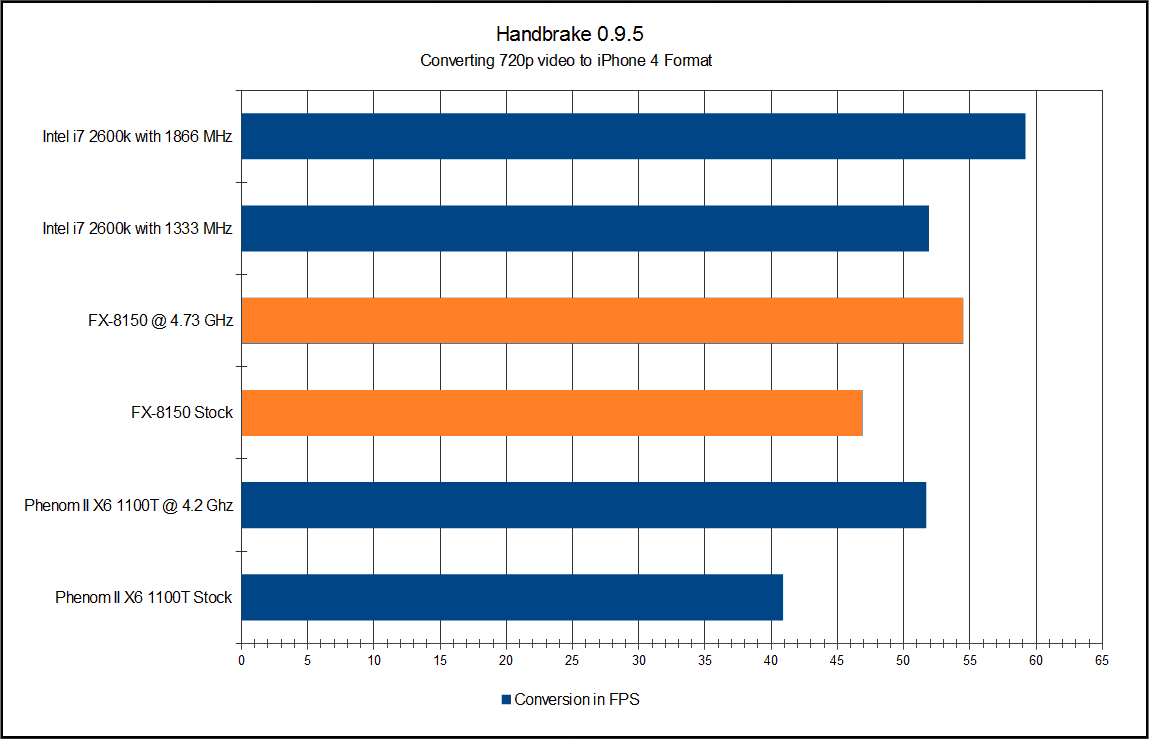
Handbrake on the other hand is not well maintained and has not seen a major update for some time. It runs on a very old compiled code that does not take full advantage of newer instruction sets. The FX-8150’s eight cores holds a decent lead over its six core Phenom II 1100T brother and both fall behind the i7 2600k. Overclocking once again provides improvements, but it is not uniform. The 1100T gained 11 FPS from a 500 MHz over its Turbo mode; however, the FX-8150 gained only 7.5 FPS from a 800 MHz over Turbo mode. This is a case where the seemingly weaker integer core power comes into play in a real world case.
7-Zip – Single Thread Testing
I would like to further examine the issue of where Bulldozer keeps stumbling over itself. For this I decided to use the 7-Zip benchmark. This benchmark decompresses blocks of data from a larger file and thus the workload is not uniform. As such the OS will assign the first available core for each block so the workload moves from core to core. I ran one test where I allowed this to happen and then another with the OS affinity locked to a single core on the chip. If the Prefetch and Scheduler on the chip is the weak point, letting the OS pick which core to work on should hurt performance. If it is the integer core that is the weak point, locking it to a single core should be slower. In either case, we know from previous testing the instruction set will not be getting in the way.
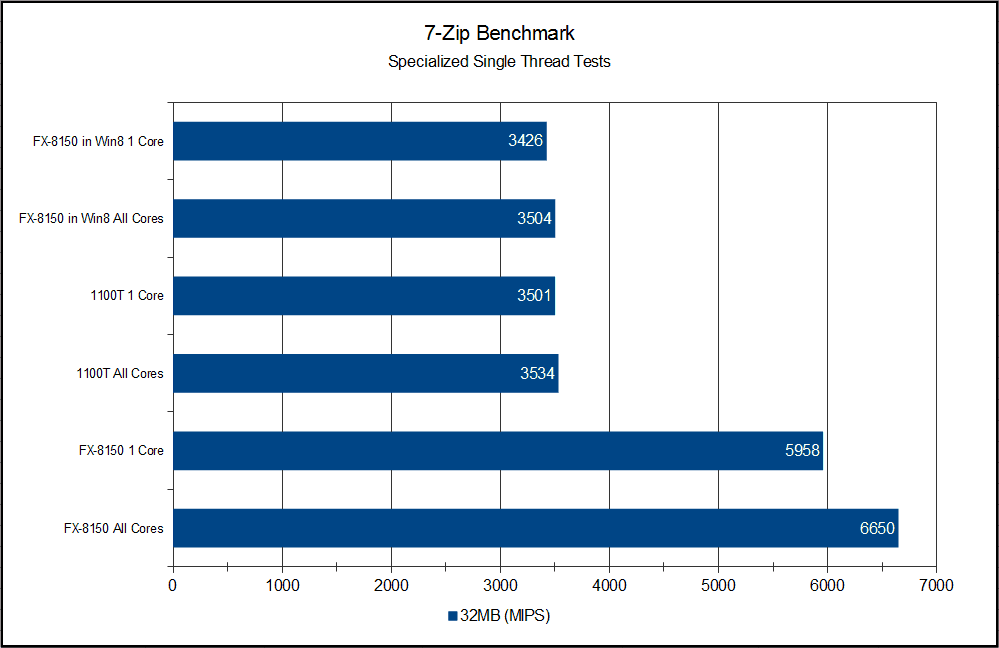
The result clearly shows forcing a single core to do the all the work hinders performance by 10.4%. The Prefetch and Scheduler have little work do when the affinity is locked to one core. When all cores are accessible, the Scheduler constantly has to check for idle cores to assign the work. The performance improvement could also be simple efficiency as the Prefetch and Scheduler could assign a different core a workload prior to the first block of work being complete on another core. This practice would give the next core a head start and cut down on CPU down time.
Also note there is a massive drop in performance for 7-Zip in Windows 8. I am baffled as to why this happened as Windows 8 is suppose to improve Bulldozer performance.
Resident Evil 5 & Alien Vs. Predator – Older Title Gaming Performance
Now lets revisit the all important gaming performance. We will start with some older titles that span across all three major DirectX versions. The DirectX 9 and 10 test were done with Resident Evil 5 Variable Benchmark at maximum settings at 1920 x 1080 resolution. The DirectX 11 test is done with Alien vs. Predator on default high settings at the same resolution.
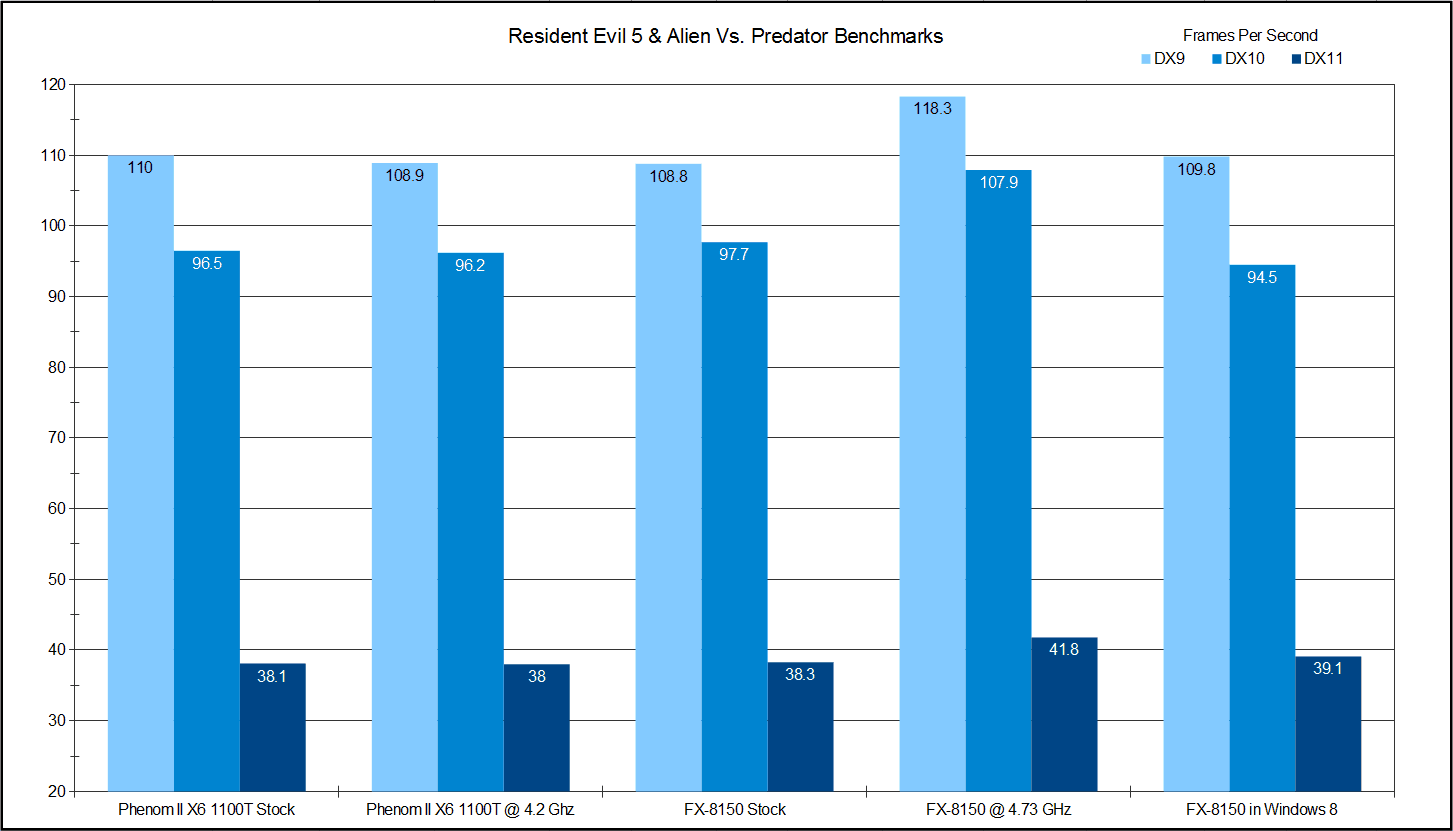
While the difference in performance is minor, it gives us a lot of information. First, overclocking the 1100T actually hurt its performance in every test. On the other hand, the FX-8150 has respectively large gains in every test when running at 4.73 GHz. At stock speeds, despite a clock speed and core count advantage, the FX-8150 falls just behind the 1100T in DX9. The FX does slightly better in both DX10 and DX11. Then when I switched to Windows 8 Dev. Preview the FX-8150 shows gains in DX9 and DX11 with a drop in DX10.
Deus Ex: Human Revolution – Single Threaded Gaming Performance
Deus Ex: Human Revolution is one of the few games who were closely tied to ATI during development. It is only the second title I am aware of that was built from the ground up with ATI Eyefinity in mind. It is also unique as it was released only a short time ago and runs the entire game on a single thread. It is very very rare for a triple A title in todays market not take full advantage of multi-core systems. This test was done at maximum settings at 1920 x 1080 resolution, Vsync disabled and motion blur disabled.
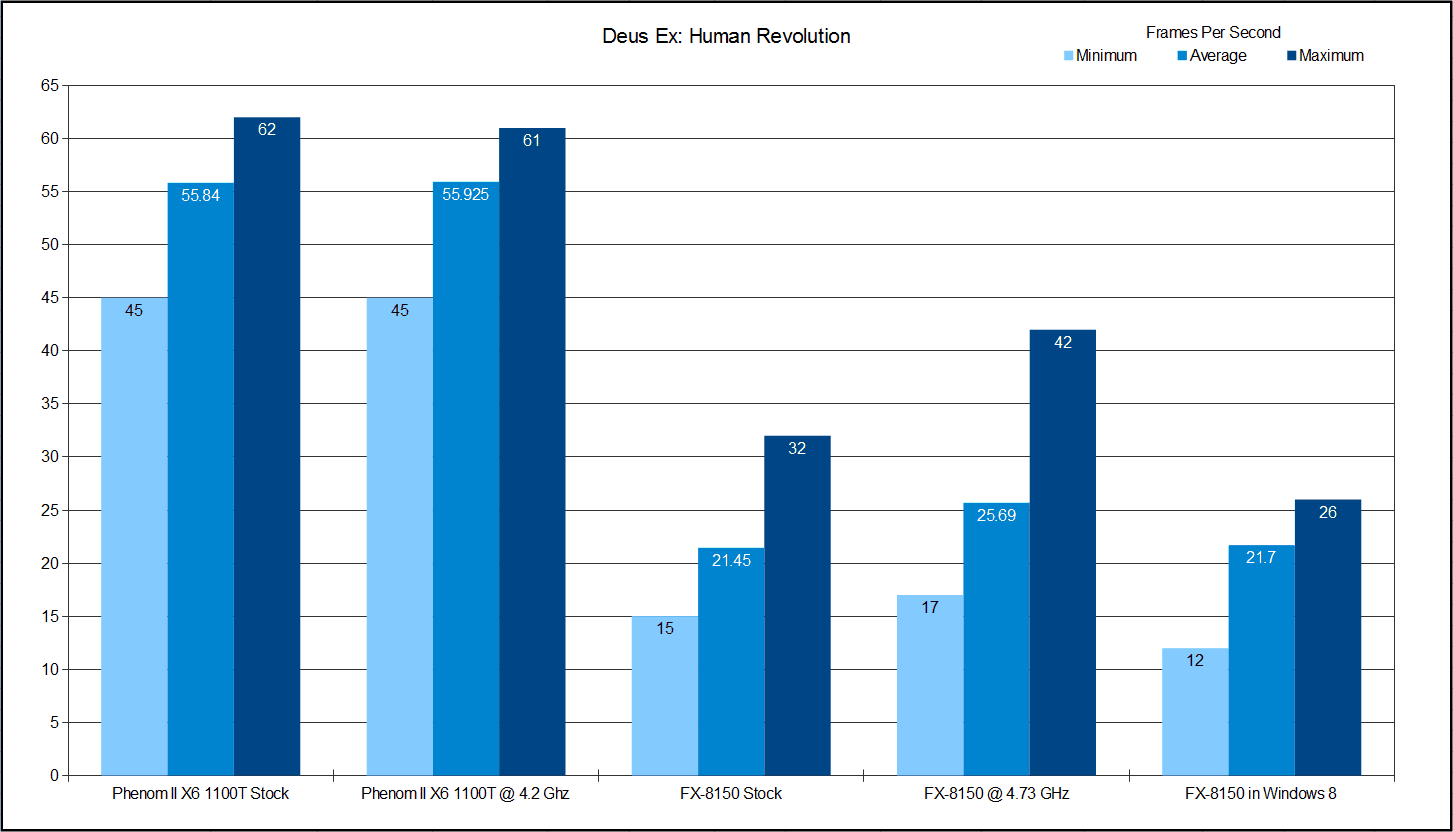
The FX-8150 is crippled by this game running a single thread on one core. It is completely unplayable and holding the GPU’s performance back. While it could be the Bulldozer cores struggling with this type of single threaded processor, I am inclined to blame software. AMD provided figures for expected performance in this game and my scores are not even in the same ball park. I also notices some other sites did not have this issue either. I am not sure what is wrong here, but I witnessed first hand the choppy, broken gameplay with painfully slow menu animation.
Metro 2033 – Mult-threaded Gaming Performance
Metro 2033 is notorious for bringing custom built machines to their knees. It is a very GPU heavy game, but also requires a decent quad core processor to run it smoothly on high settings. Once again these test were done with the maximum possible settings at 1920 x 1080 resolution.
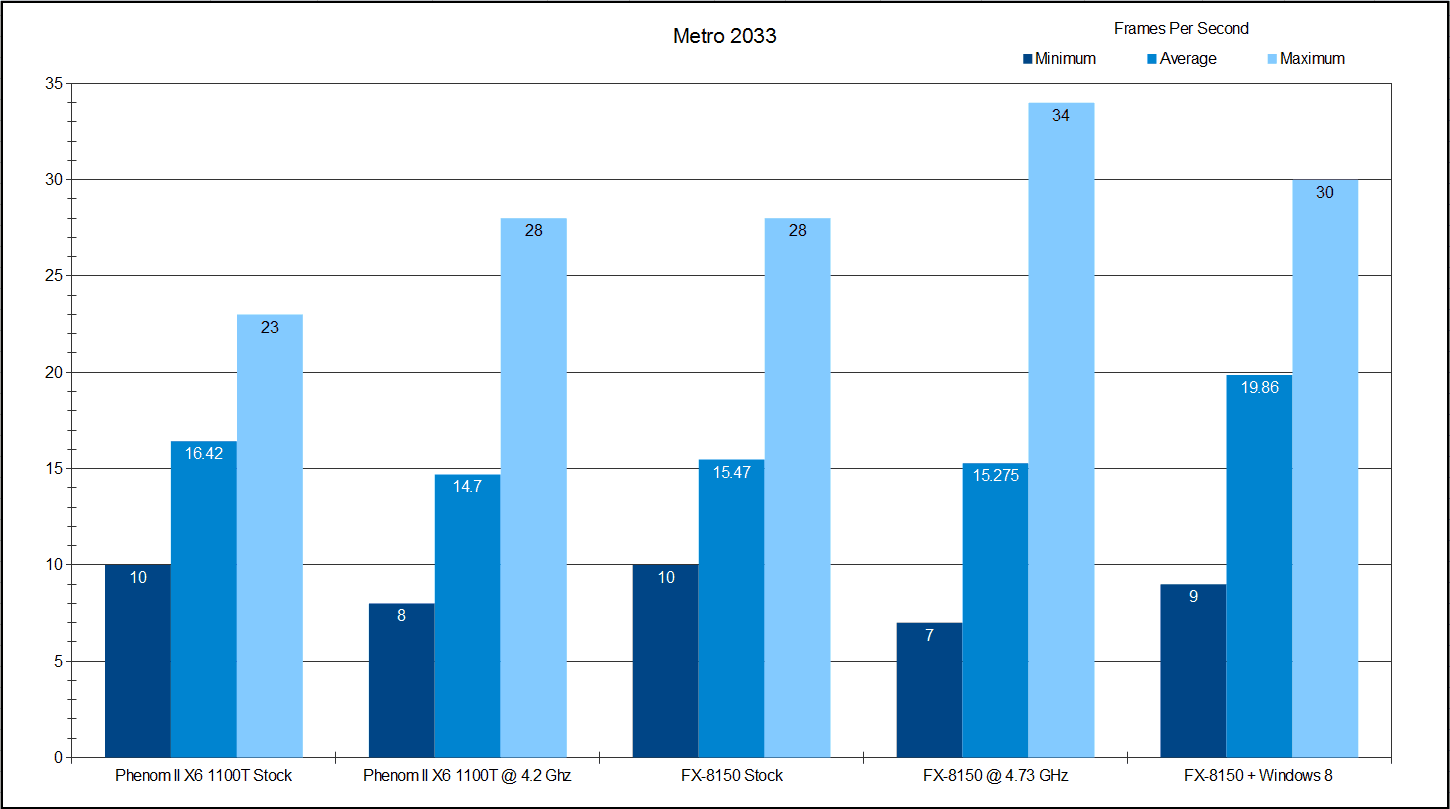
This time Windows 8 manages a victory as it brings up average frame rate by almost 25%. It also improves maximum frame rate. While I would normally say this maximum could be a fluke, the gameplay itself was much smoother in Windows 8 Dev. Preview. You can also see Metro 2033 does not take kindly to overclocking as it brings both minimum and average frame rate down for both processors. This game is also one of the occasions were the FX-8150 does not bring any additional benefit to the table.
Power Consumption
There has been a lot of people claiming the FX-8150 will eat power once overclocked and I am sure it will when you set all the voltages to what AMD stated as their maximums. Any system with voltage numbers set to maximum for all options will burn a lot of power and it will not just be the CPU causing the increase.
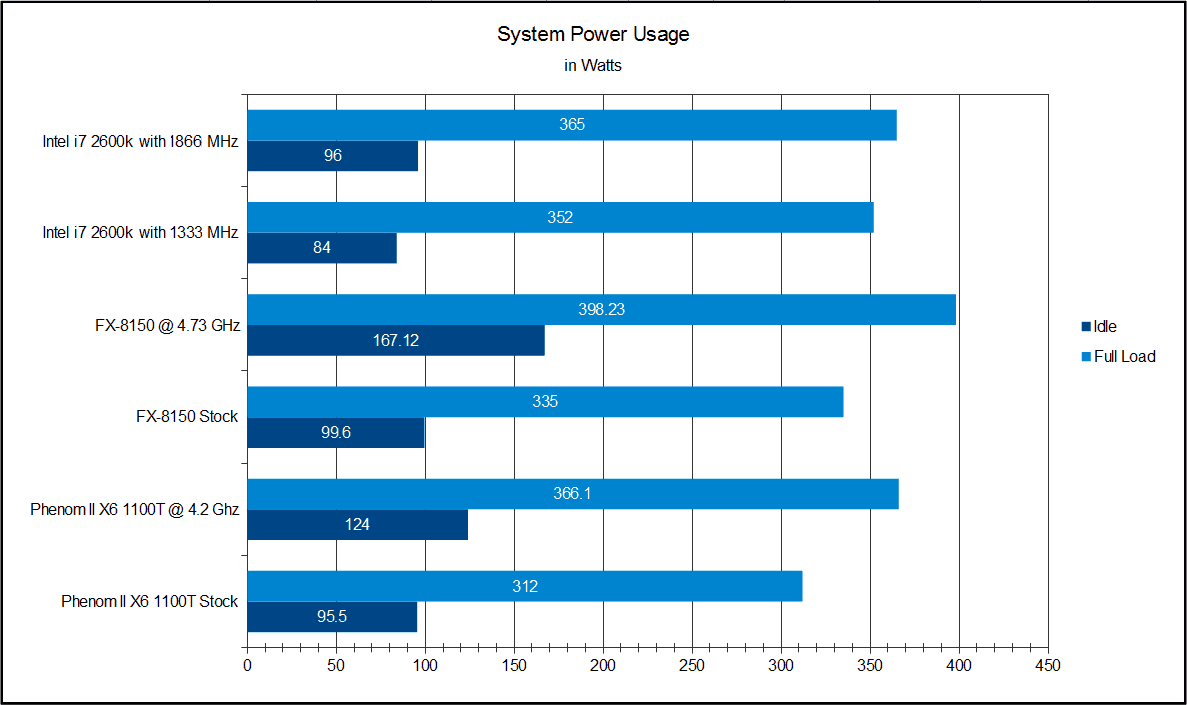
I do not have the restrictively expensive equipment I would need to test just the CPU’s power use, so these figures only apply to me and my particular system. As you can see the power figures fall right in line. The FX-8150 has 2 additional Integer cores and thus uses more power at both idle and load. The Intel system has a more power hungry GPU and thus uses more power at load. Nothing here was really out of the ordinary to me.
There is a wall at around 4.8 GHz for the FX-8150 and getting over it will take a lot more power than I was willing to give my system. While it did not work for long, the 5.2 GHz stress test seemed to show power use well into the mid 400 watt range. I would image getting it to be stable at that speed would require even more power than I was giving my system at the time.
Final Thoughts

There has been a lot of talk on the Internet about lack luster performance and disappointed reviewers of the Bulldozer processor. I am personally not disappointed, but I am not impressed either. The “FX” moniker stood for the top performing chip of its time no matter how you sliced it. Bulldozer is a brilliant, forward looking design, but it does not deserve the “FX” title.
The issue with the Bulldozer design is it seems to have something personal against old software. Since many of the programs used for testing attempt to keep the scales even across several generations, testing programs inherently have to use older software designs. Simple put, Bulldozer does not benchmark well, but does well in real world scenarios.
I cannot conclusively say why the FX chips struggle with single threaded applications. I can say it only applies to single threads that repeat a single task constantly such as cryptography, video encoding, Folding@Home, etc. And even then it only struggles when the program is either really old or using old instruction sets. When the process is a task that works in blocks, such as video streaming, web browsing, file scanning, etc. there is no issue. In either case, it is clear the FX-8150 will easily out perform the 1100T when newer compiled code uses the newest instruction sets such as AES and SSE4.2.
I have used the FX-8150 for well over a week as my daily system and I have not once thought it was slow. The software I know it lacks performance in are trivial programs such as web browsers, temporary file cleaners, multimedia players, and old games. These programs are simply not CPU intensive enough to have noticeable performance loss. On the other side of the spectrum, the software I use that does require a lot of CPU horsepower, the FX-8150 excels in such as 7-Zip, Battlefield 3 (we’ll revisit this in an upcoming article), virus scanning, and video encoding.
Then you have games built for two and four core systems in mind where performance is no different than the Phenom II.
The performance, when measured, is a roller coaster ride of massive rises, dips, and turns. It is that very lack of clear improvement across the board that is making people scratch their heads. I agree with them wholeheartedly that the Bulldozer Tunnel Vision looks bad when tested. No one should need to find the right software to properly utilize a Bulldozer processor, or count on future software updates to give them better results.
In the end, the FX-8150 can be found at $279.99 between the i7 2500k and i7 2600k. It is priced exactly where it should be considering its general performance. Though I can’t recommend the Scorpius platform for everyone, those that do invest in it will not be disappointed in its overall performance. It should be a great upgrade for those using Phenom II X4s or for anyone looking to build a reasonably priced gaming system today. Everyone else should just wait to see what the future holds as FX chips seem to be doing the same thing too.
Pros
- New Instruction Sets
- Great Multimedia and Computational Performance
- Improved Memory Controller
- SLI Support
- Consistent Features Across all 900 Series Motherboards
Cons
- Weak Single Thread Performance
- Inconsistent Multi-Threaded Performance
- Overall Performance does not Warrant “FX” title
- Some 800 Series AM3+ Motherboards will still Need BIOS Update to Support FX chips
Overall Rating: 7.0 / 10.0
Help Us Improve Our Reviews By Leaving a Comment Below!