PCMark07 – Total System Performance
PCMark07 is a simple way to get an idea of your total system performance. This time we will including the overclocking numbers and an Intel Sandy Bridge system for direct comparison. Please note the GTX 560 Ti is a much better graphics card than the HD 6850 used in the AMD systems.

As you can see there seems to be a strange software glitch in PCMark07 software. I checked individual test results for the overclocked FX-8150, which can be seen here, to compare to the FX-8150 stock results. The results from each individual test showed better uniform performance when overclocked, but the final score did not reflect this. It is clear the software just failed to calculate a final score for each area except for Computational testing.
In the Computational results we can see the 1100T falls behind the FX-8150. Once overclocked to 4.73 GHz, the FX-8150 bests the i7 2600k using recommended memory speed by a mere 337 points. When both the FX and i7 are at 1866 MHz, Intel pulls ahead by 255 points. In this particular type of workload, AMD cannot match the Core i7 2600k without a bit of trouble.
3DMark11 – Synthetic Gaming Performance
This test will show what you can expect in general from an FX-8150 in a gaming environment. Since this test is very GPU centric, I will not included the Intel System results as the 560 Ti is much more powerful than the HD 6850.
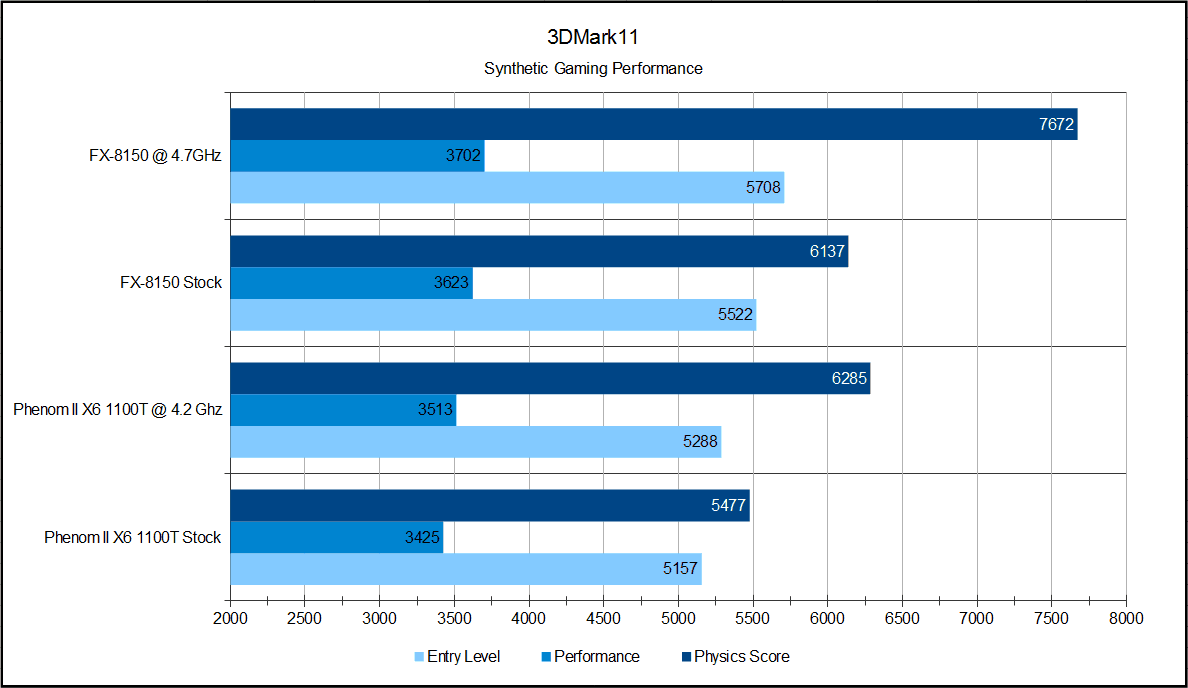
Once again the FX-8150 is ahead of the 1100T by a very comfortable margin. Even with the 1100T at 4.2 GHz, it falls just short of the FX-8150 at stock. The gap only grows larger as the FX-8150’s clock rate increases. This should mean the FX is a better choice in gaming, but we already know this is not true for all titles. In heavily threaded games or games that need a lot of software physics, the FX-8150 should pull ahead.
wPrime – CPU Performance on Old Programs
I want to start CPU specific testing with wPrime. It’s a test commonly used by the overclocking community to test the stability of their systems. In this case, we will simply use it to test performance of the FX-8150 on older software using very dated instruction sets.
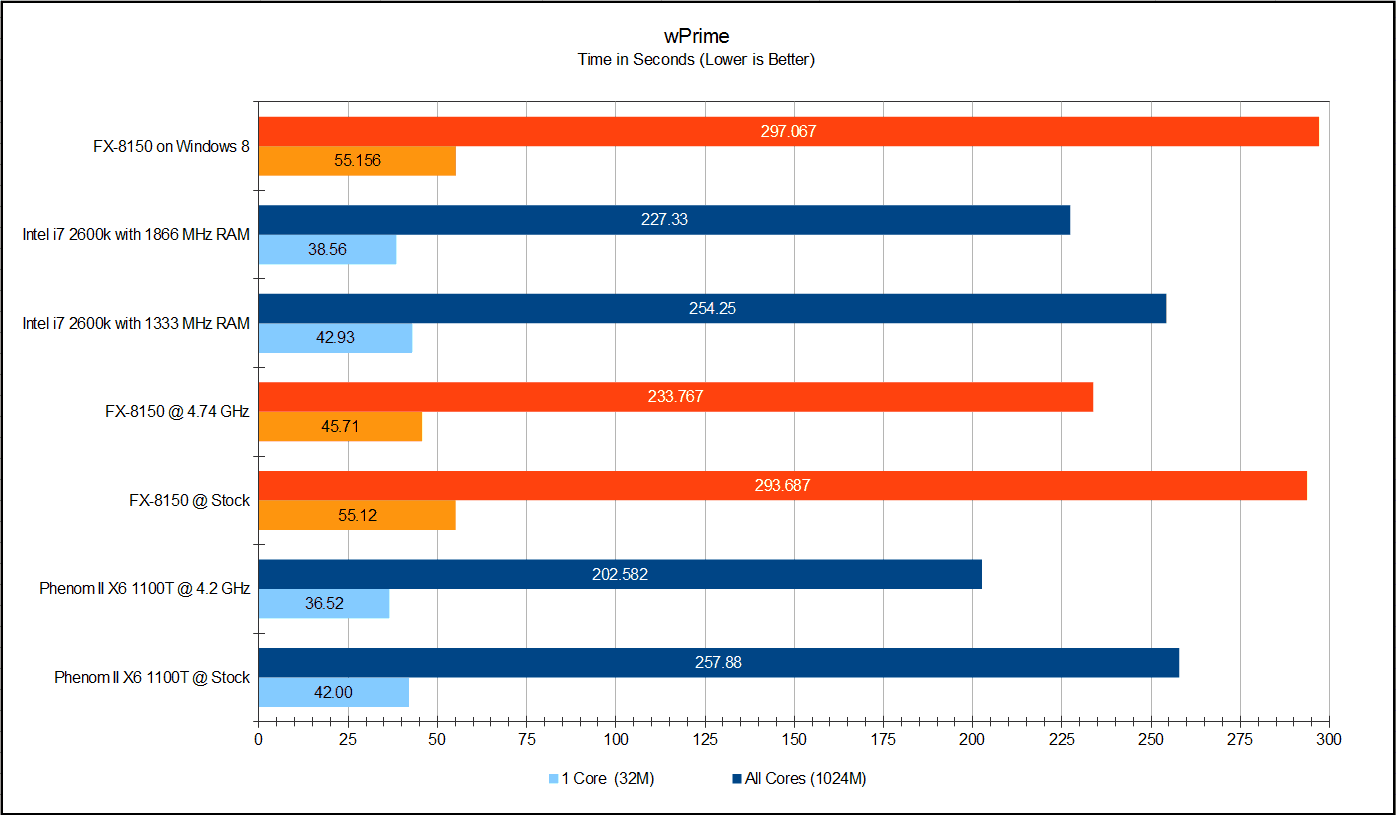
This is not a very good test for the FX-8150 as the results show it coming in last behind both the Intel i7 and the AMD Phenom II. Even when overclocked to 4.73 GHz, it has a hard time keeping up in multi-threaded test. The overclock is still not enough to help the single thread test here. We will look into this performance issue further a little later in the article.
Cinebench 11.5 – CPU Rendering Performance
Cinebench 11.5 is designed to test a CPU’s 3D rendering capabilities. Much like the above test with wPrime, I am trying to narrow down specifically what tasks the FX-8150 loses performance. This should help narrow down if there is an issue with how software is handled by the FX-8150, or if the integer cores are simply weaker than previous generations of AMD chips.
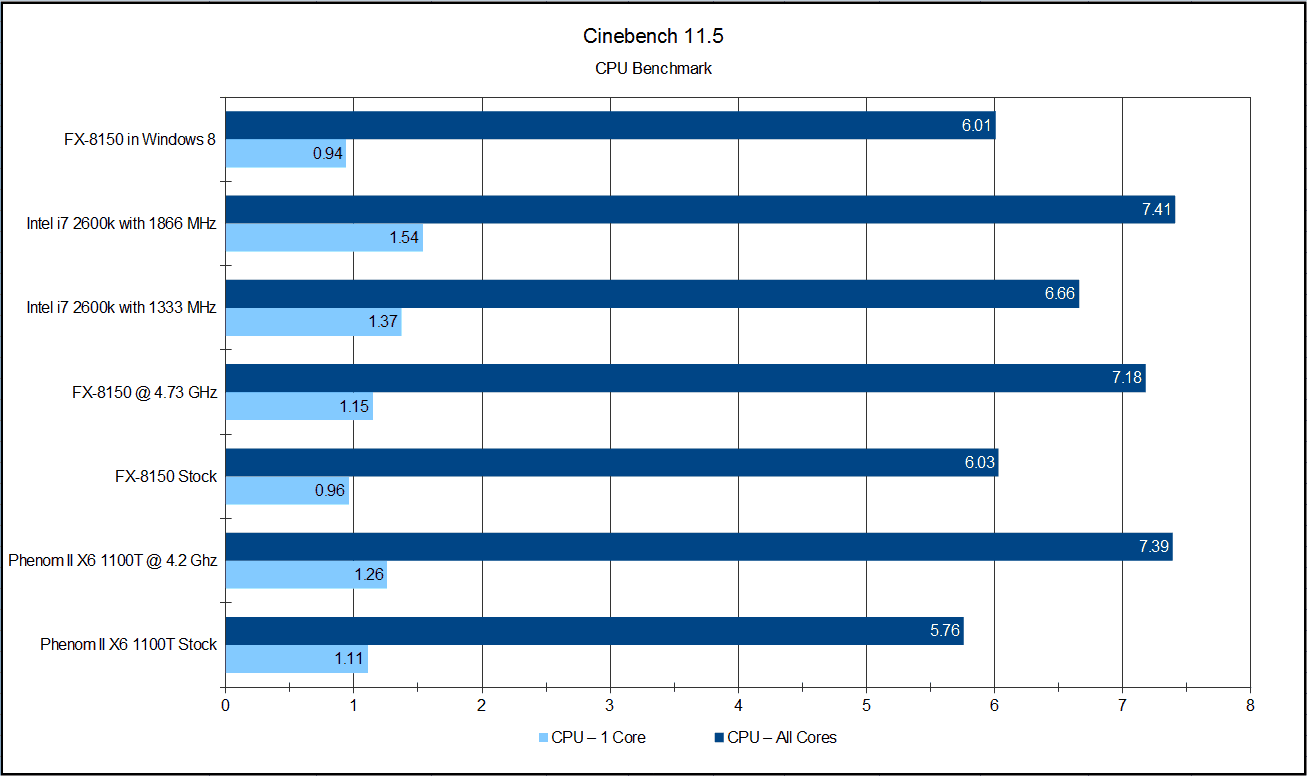
The FX-8150 single thread test reflects our previous two test with a lower performance than the other two chips. The multi-thread test for the FX is 6.28 times better. Since ideal would be 8.0 this gives us an efficiency of 78.5%. The 1100T is 5.19 times faster or 86.5% of its ideal and the i7 2600k is 4.86 times faster or 83.25% of its ideal performance. This is not a good sign as the FX-8150 appears to be less efficient than previous generations of AMD chips. It is also being out performed in rendering by a chip with two fewer cores.
Sandra 2011 SP5 – CPU Performance
We will now move on to testing different portions of the CPU itself to see where this performance issue is found in the hardware. Sandra 2011 is a collection of several benchmarking tools I will use to focus on CPU performance and the on-die memory controller. I am including my test results for Windows 8 Dev. Preview in all the Sandra benchmarks. The first test will be the memory bandwidth and efficiency.
The first set of CPU tests is the Dhrystone ALU test which is a program small enough to fit in the CPU cache. It is mainly focused on tested the raw horsepower of the integer cores. The second test is the Whetstone iSSE3 benchmark which is as old as the Algol 60 programming language (1972). This test is focused on the performance of the FPU portion of the processors. The multimedia testing centers around the MMX and SSE instruction sets. This means the multimedia test is the only one that focuses on how well the instruction sets are utilized and not the power of Bulldozer.
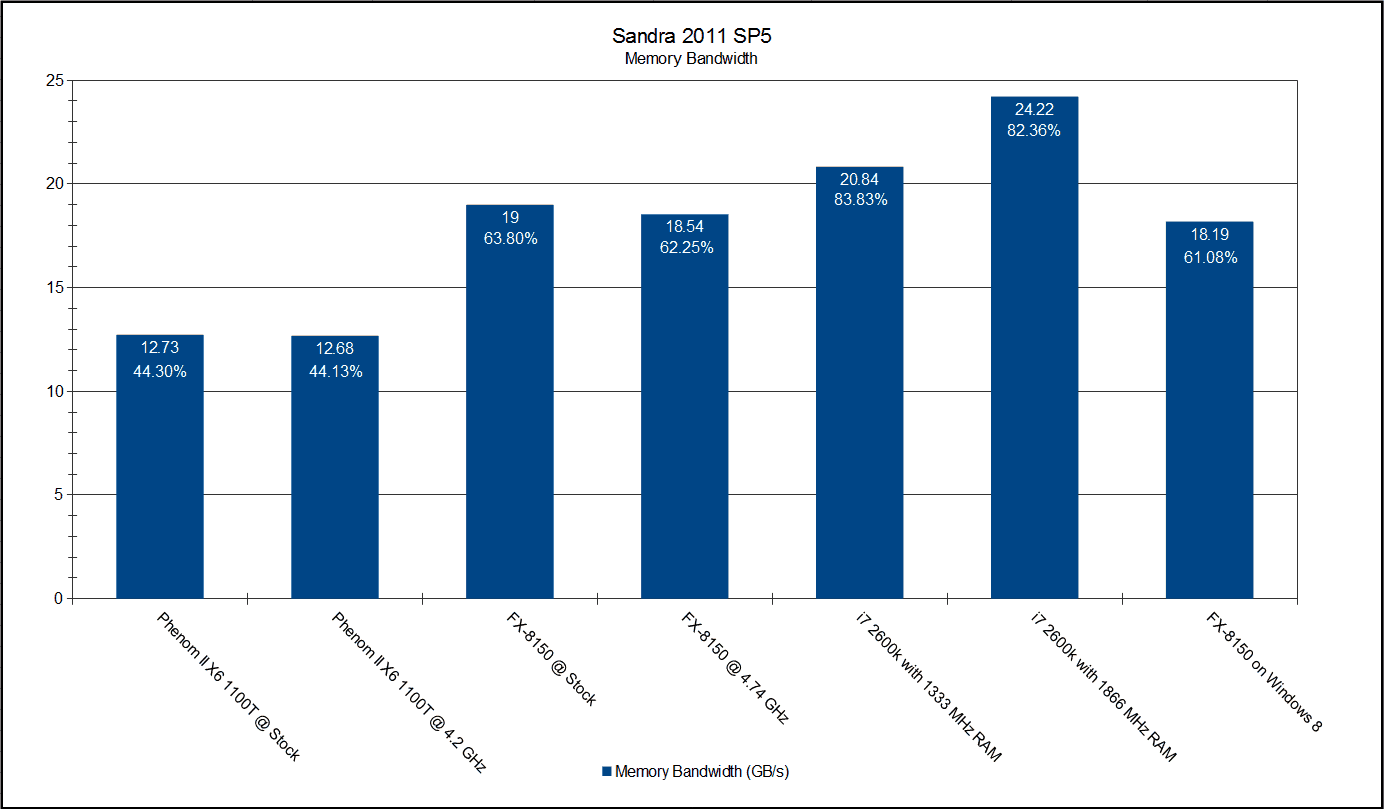
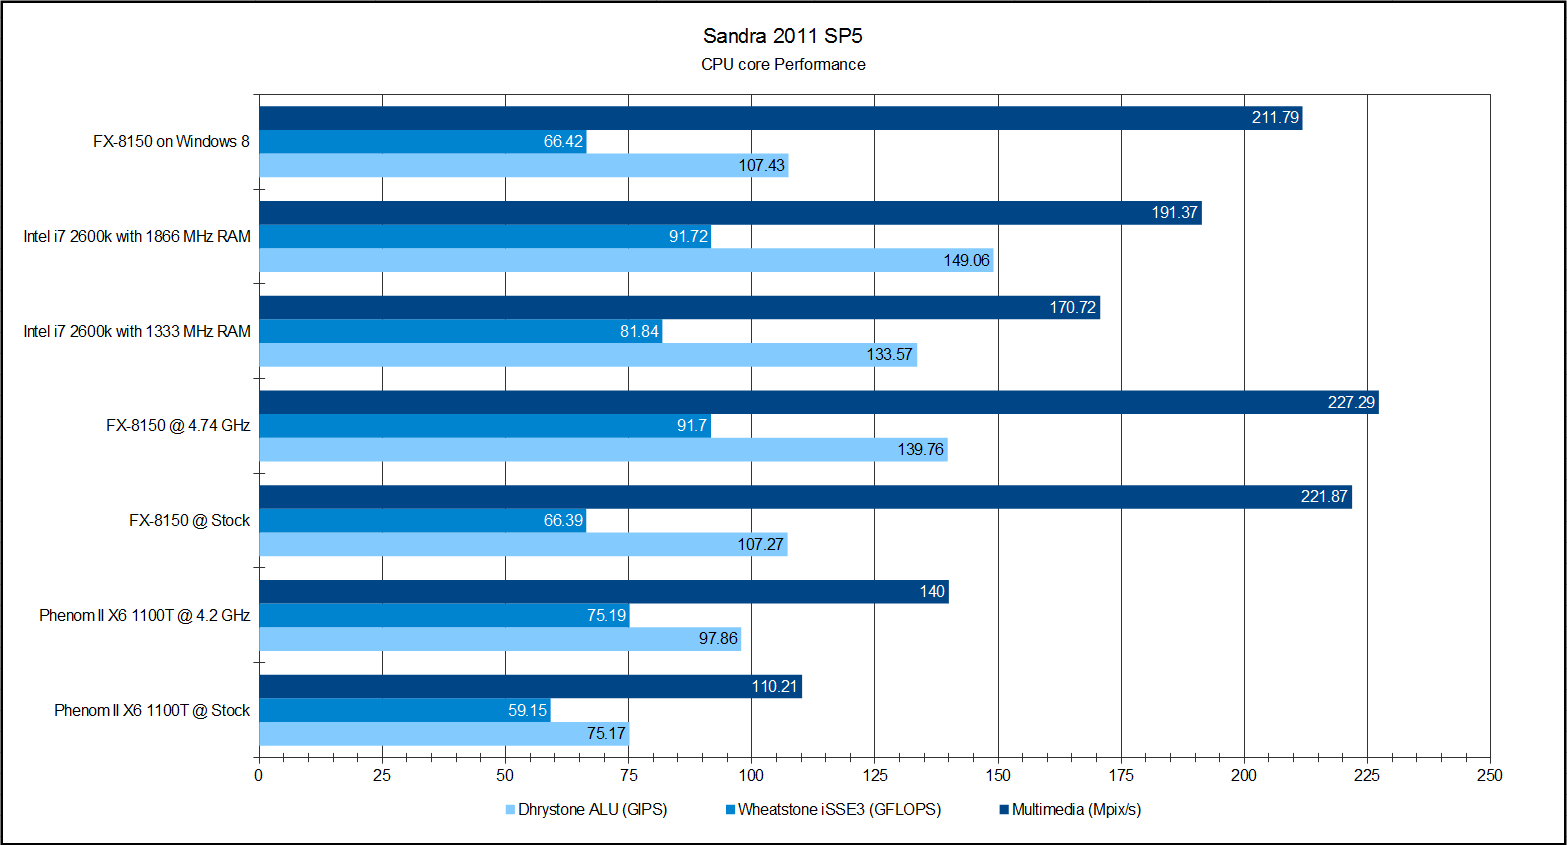
The reason I started with the memory test is that a lot of CPU heavy tasks involving large scale number manipulation. They are often limited by memory performance. As you can see, there are very distinct jumps in memory performance and efficiency going from Phenom to Bulldozer to Sandy Bridge. This same pattern is carried over to the Dhrystone and Whetstone tests. As memory performance increases, so do the performance of these test results. This does not hold true for the Multimedia test where the AMD FX-8150 holds the top spot. This is expected as the benchmark is optimized for an AMD Athlon using the MMX instruction sets as a baseline of comparison.
The Cryptography tests (SHA and AES) test the processors encryption and decryption abilities. Note the Intel i7 and FX-8150 have the AES instruction set and as you saw in Part 1, the 1100T will not even be close in this test. the SHA testing does not have specialized instruction sets, so its results should be very different.
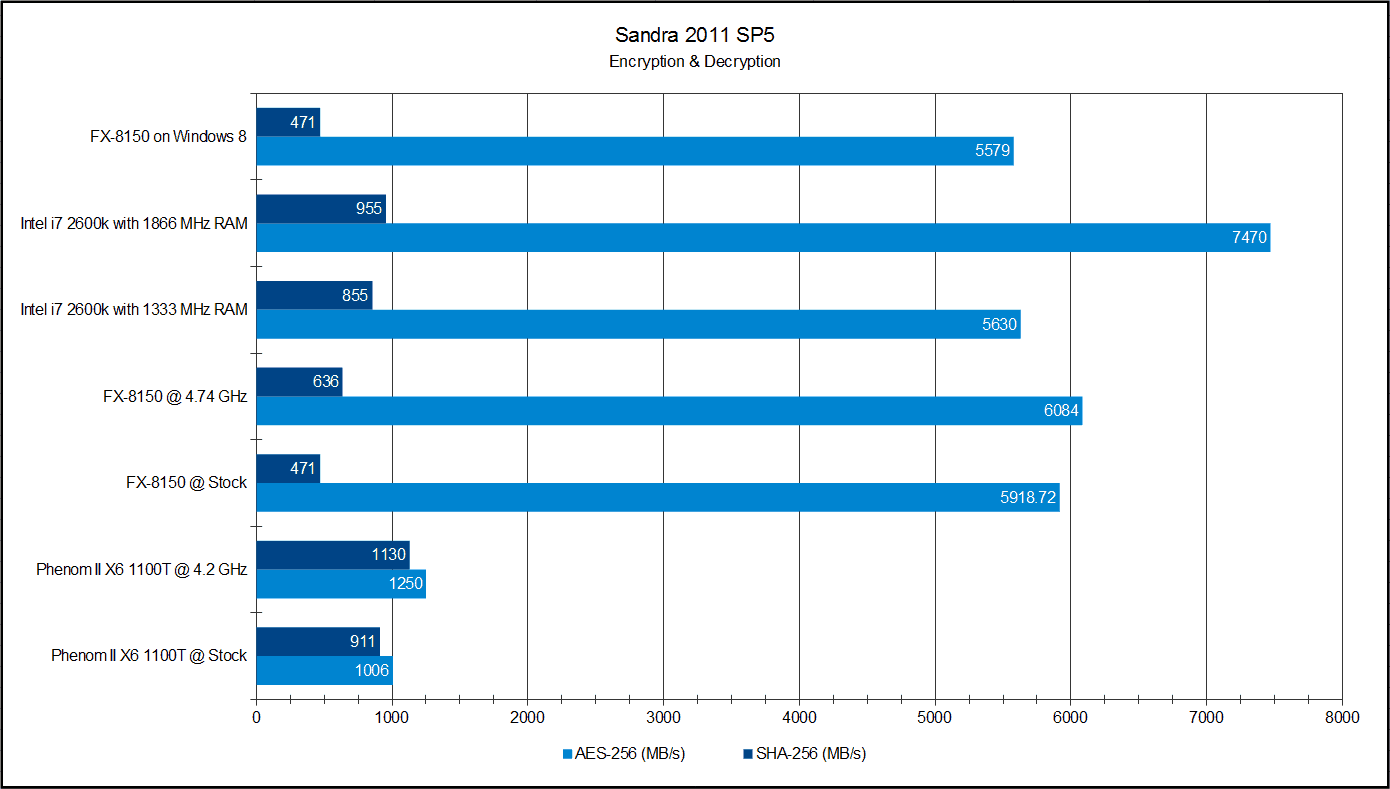
The Cryptography test proves the most unusual result. The FX-8150 drags its heels in the SHA-256 test falling well behind even the 1100T. The AES-256 test on the other hand, is unfair to even include the Phenom II 1100T as it does not have the AES instruction set. The FX-8150 does well against the i7 2600k when both use their recommend memory speed, but the 2600k pulls well ahead when both are using 1866 MHz memory speed.
The results clearly show this test is limited by memory speed. Even when overclocked by 830 MHz, the FX-8150 gains a measly 2.72%. This is one test where the bus overclocked (which would have give a memory speed of 2006 MHz) would have been the better choice.