Total System Performance (PCMark07)
This is a total system benchmark to gauge how well the PC as a whole. The PCMark07 software runs a battery of 21 different test three times to ensure the most accurate results.
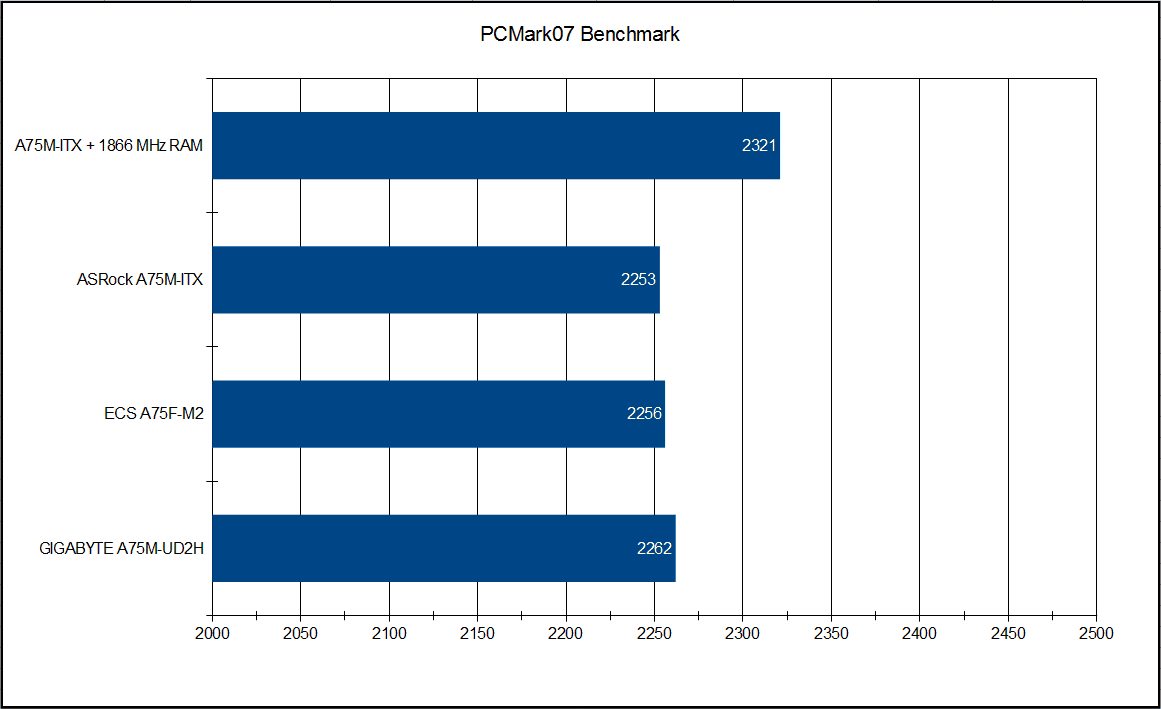
The clear winner here is simply the use of 1866 MHz RAM with your APU. The ASRock A75M-ITX does come in behind both the ECS A75F-M2 and the GIGABYTE A75M-UD2H but only by 3 and 9 points respectively. The realistic different is too minor to notice. The 68 point boost in performance from using the faster RAM can be noticable in memory intensive tasks.
SATA 3.0 (6 Gb/s) I/O Performance (CrystalDiskMark)
This test is very straight forward. CrystalDiskMark generates files of various sizes using random data and moves that data around to test the HDD performance. As I am comparing three systems where only the motherboard varies.
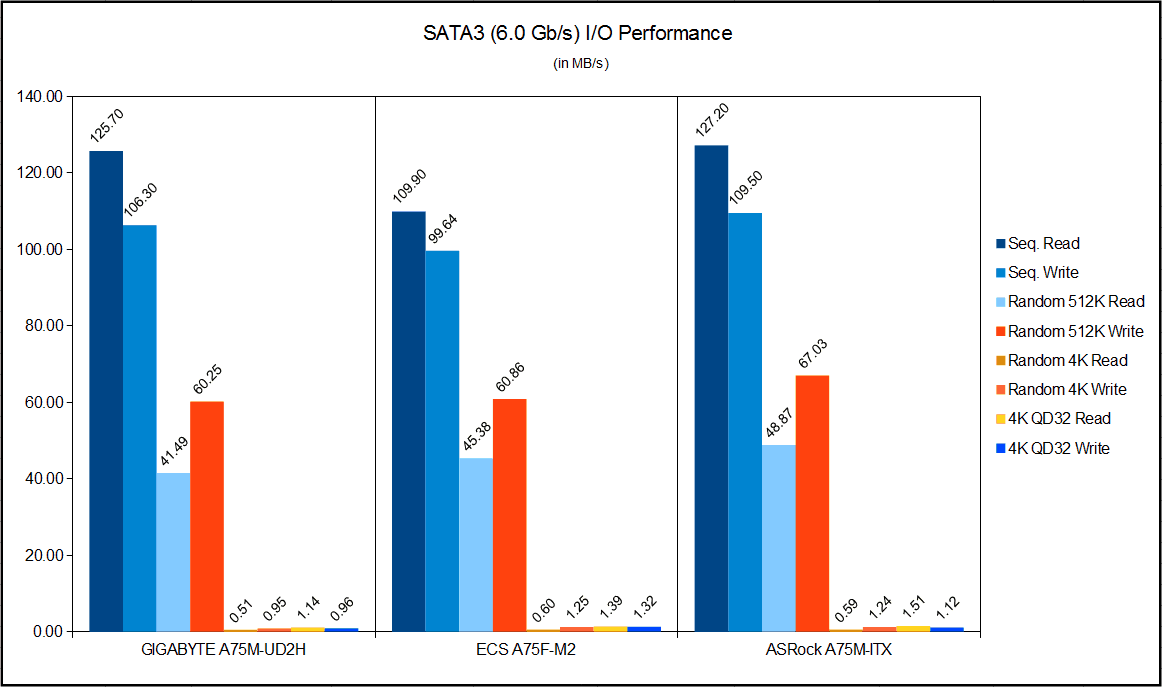
These results are quiet interesting. The ASRock A75M-ITX has a higher performance in Sequential reads and writes as well as Random 512k reads and writes. The GIGABYTE A75M-UD2H then falls to last place for all four 4k tests with the ECS A75F and ASRock A75M being virtual tied in random 4k tests and only a 0.2 MB/s difference in QD32 tests.
USB 2.0 I/O Performance (CrystalDiskMark)
I also used the CrystalDiskMark 3.0.1 software to test the USB 2.0 performance as well. This is no different than the previous tests except a USB thumb drive was the target test drive. I also included the results of enabling the XFastUSB Utility to see if it does provide any performance improvement.
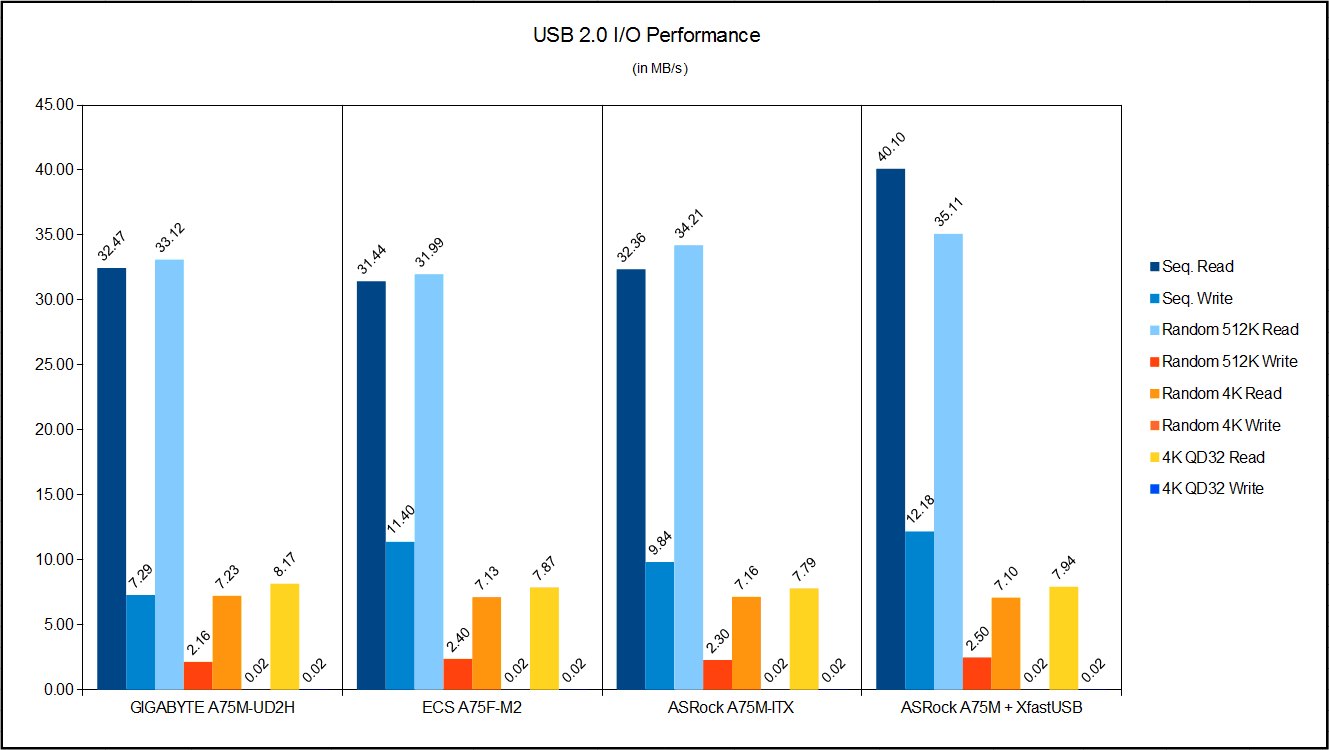
All results for the motherboard are the same for standard USB 2.0 testing with only up to a 1 MB/s difference. The only exception is the ECS A75F-M2 having a 3.11 MB/s advantage in Sequential Write over the GIGABYTE A75M-UD2H. The XFastUSB does provide a distinct increase in performance across the board except for 4k writes which seems to be limited to 0.02 MB/s for the device. The biggest gain is a near 8 MB/s gain sequential reads over all other results.
USB 3.0 I/O Performance (CrystalDiskMark)
The final set of tests for CrystalDiskMark is with the Rosewill enclosure and my Samsung F3 drive. This drive is much older and a little slower than the Seagate Barracuda used for the test system’s primary drive. The focus of this test is mainly to ensure the USB 3.0 is not be limited by the board and capable of using the 3.5″ HDD at its full speed.
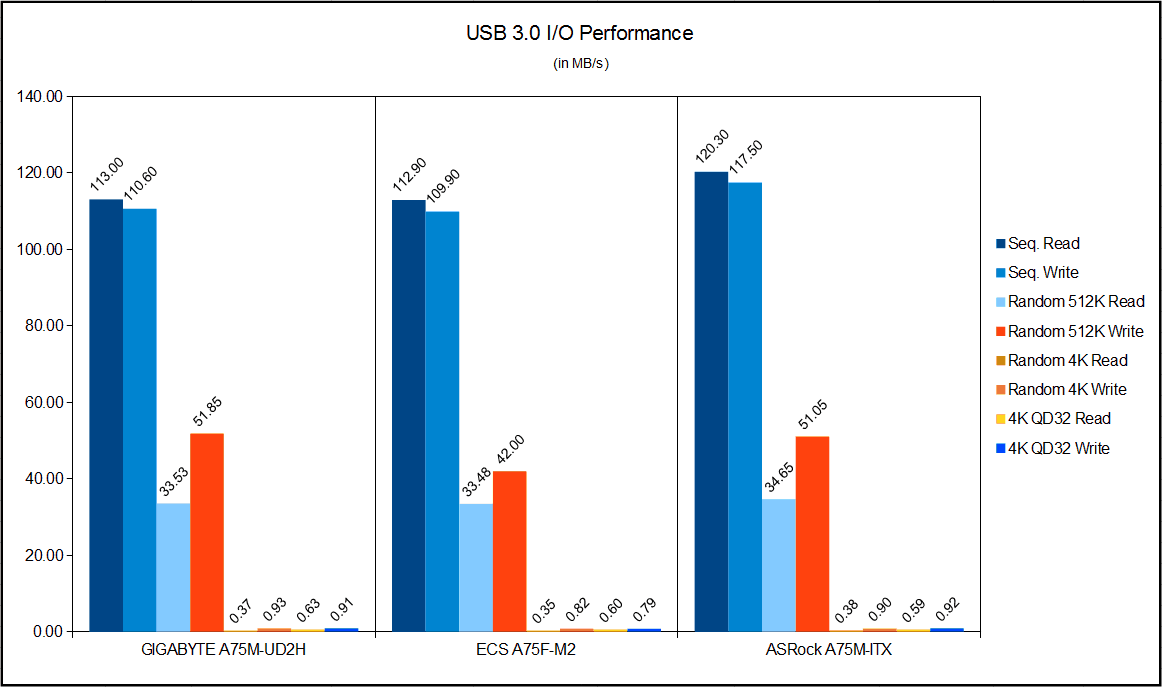
These results are just like the SATA3 results with the ASRock A75M-ITX maintaining its I/O advantage. This is good as it proves the implementation of the I/O is better than the other boards in this comparison and the previous results were not a fluke.
Synthetic Graphical Performance (3DMark11)
This test will focus on the gaming potential of the motherboard using a system of test to stress different aspects of a typical game. 3DMark11 then combines these individual tests in to one stress test to see how well the GPU can do under extreme load. Once again note the only differences in these systems were the motherboards being used.
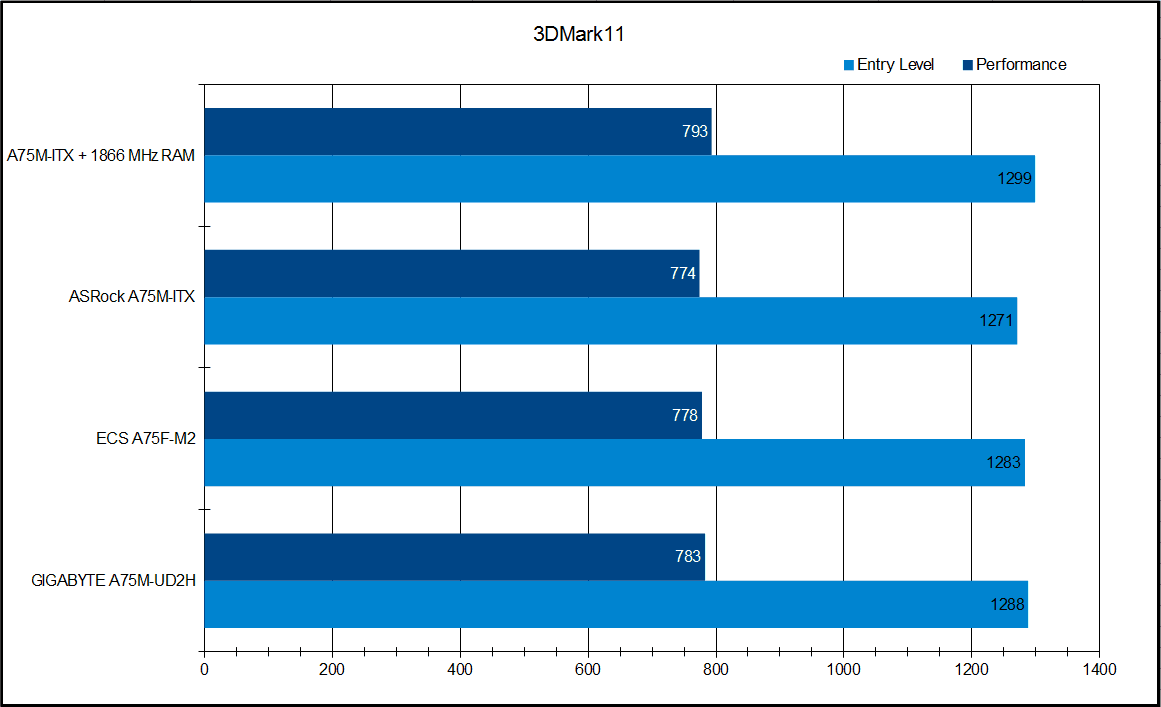
As with the PCMark07 test, the ASRock falls into last place by a single digits. Once again the switch to 1866 MHz RAM does provide slight improves in performance in both tests.
Real World Graphical Performance
Now that we have an idea of what to expect from a game, lets see of 3DMark11 results were accurate. I tested all three systems using default settings for Resident Evil 5 and Alien Vs. Predator with the resolution set to 1920 x 1080 (the most common resolution among PC gamers). Please note these settings were nearly maxed out and you can get better results in these titles with lower graphical settings.
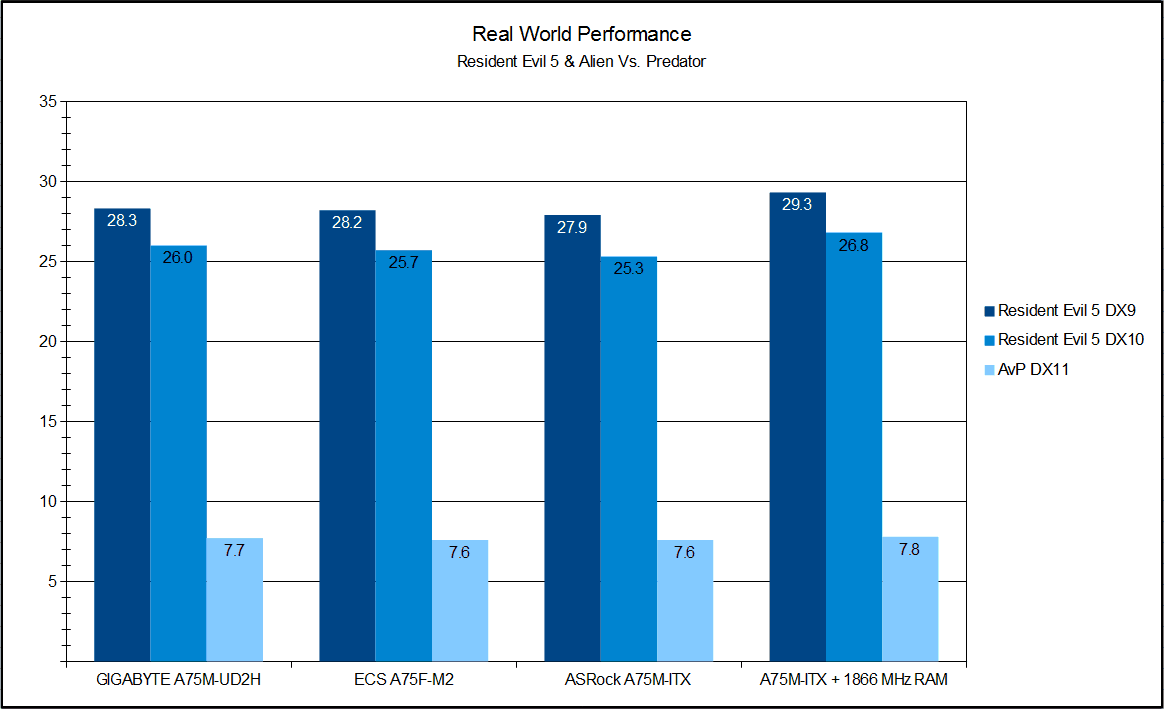
This time the results show the difference in performance is not even a full FPS between these motherboards. Using the 1866 MHz RAM was enough to put the ASRock in the lead, but by small margin. The difference in performance may seem small, but lower the graphical settings will widen the gaps seen here.